Miami Real Estate Report, January 2021 Statistics

KEY NUMBERS (Compared to January 2020)
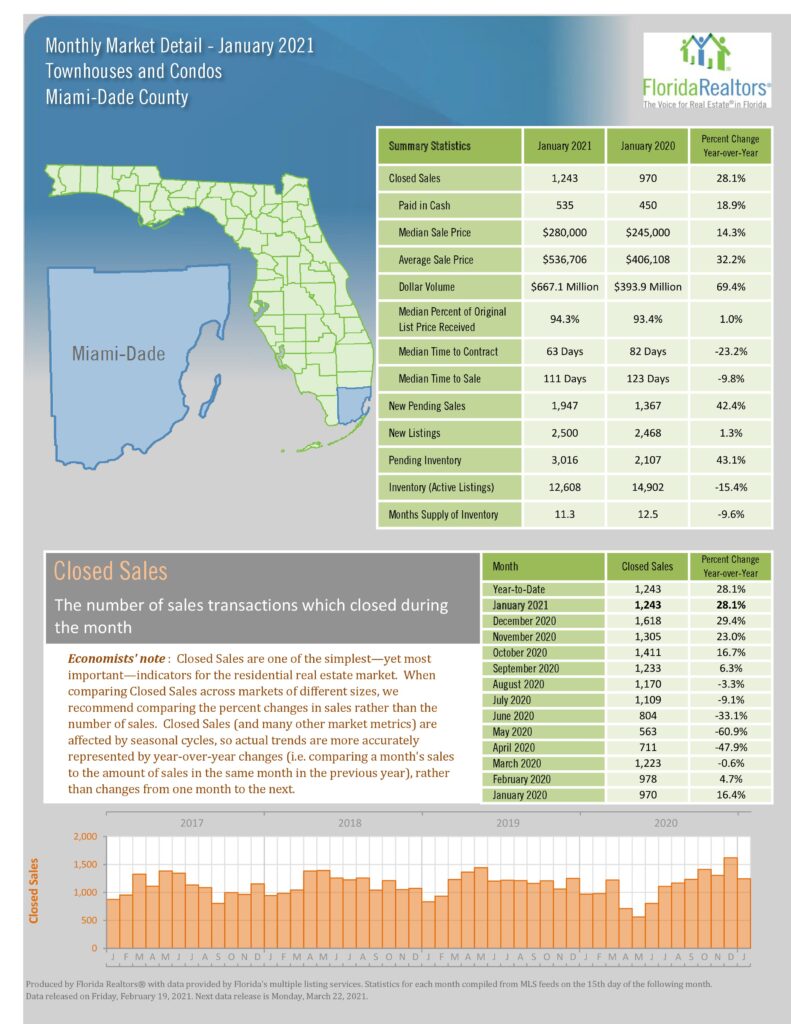
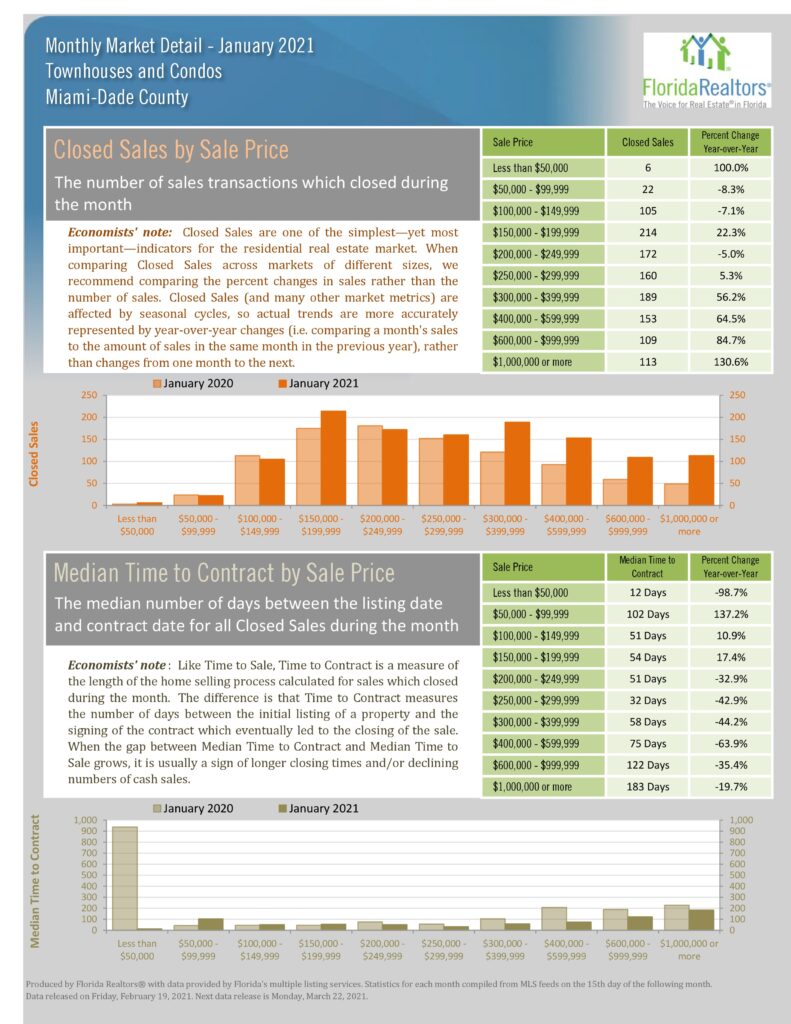
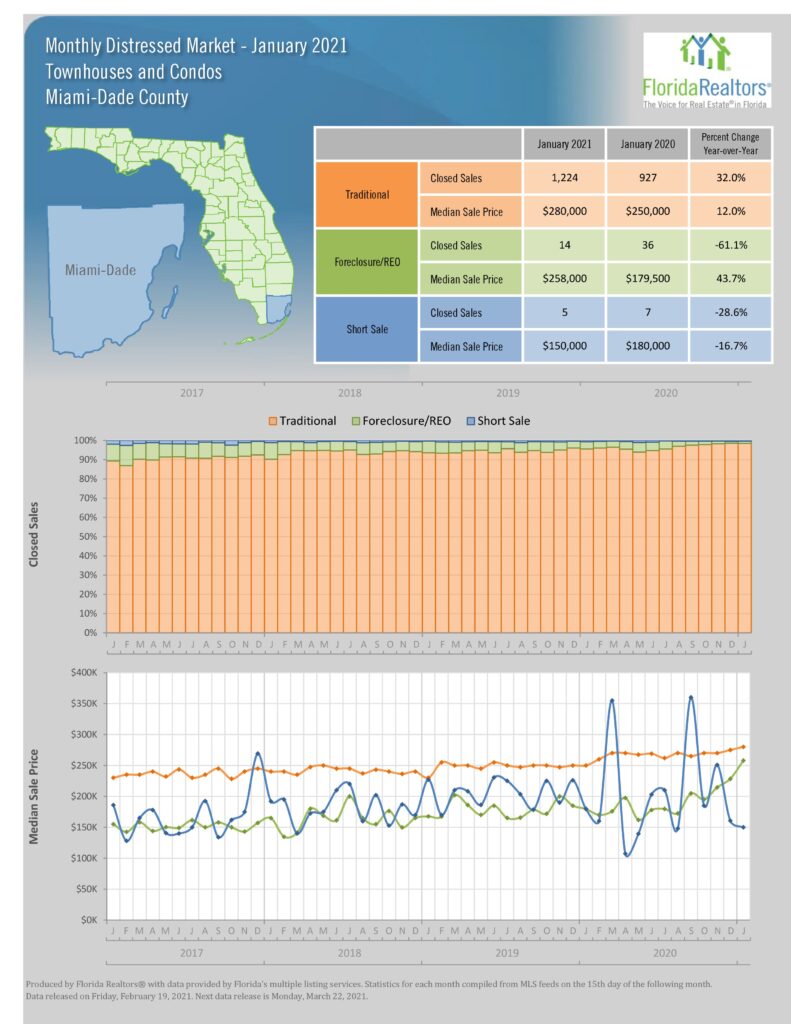
  • Number of Condo Sales Up 28.1%
  • Number of Single Family Sales Up 9.1%
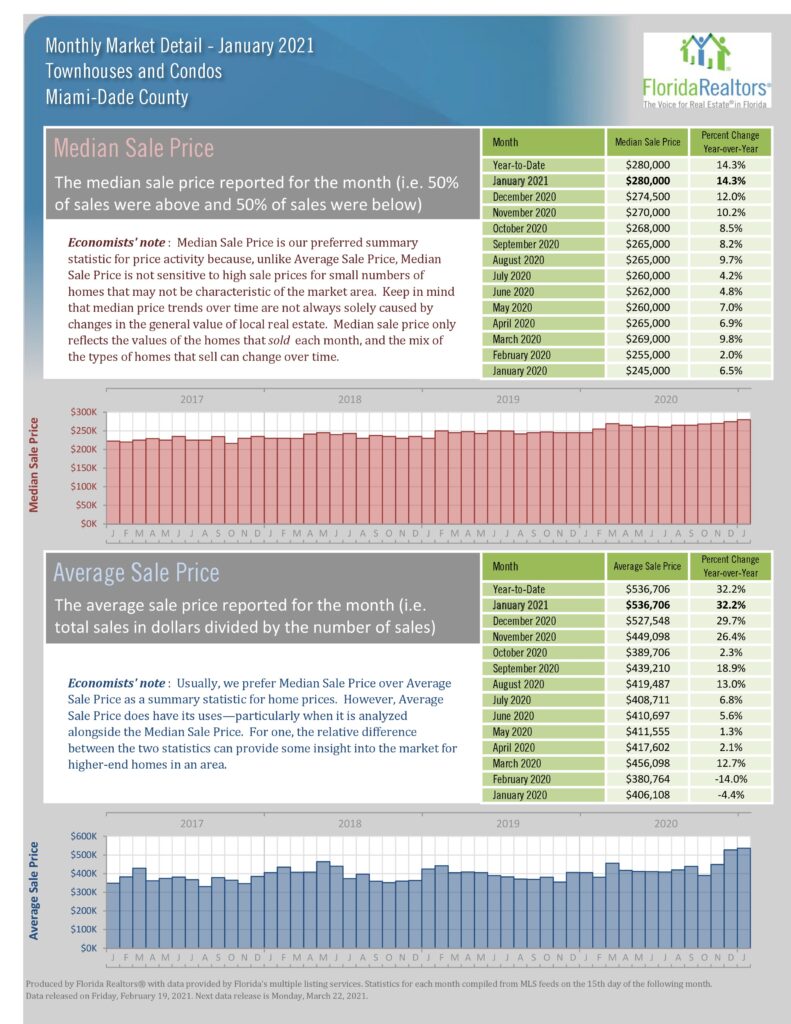
  • Median  Condo Price – Up 14.3%
  • Median Single Family Price Up 25.2%
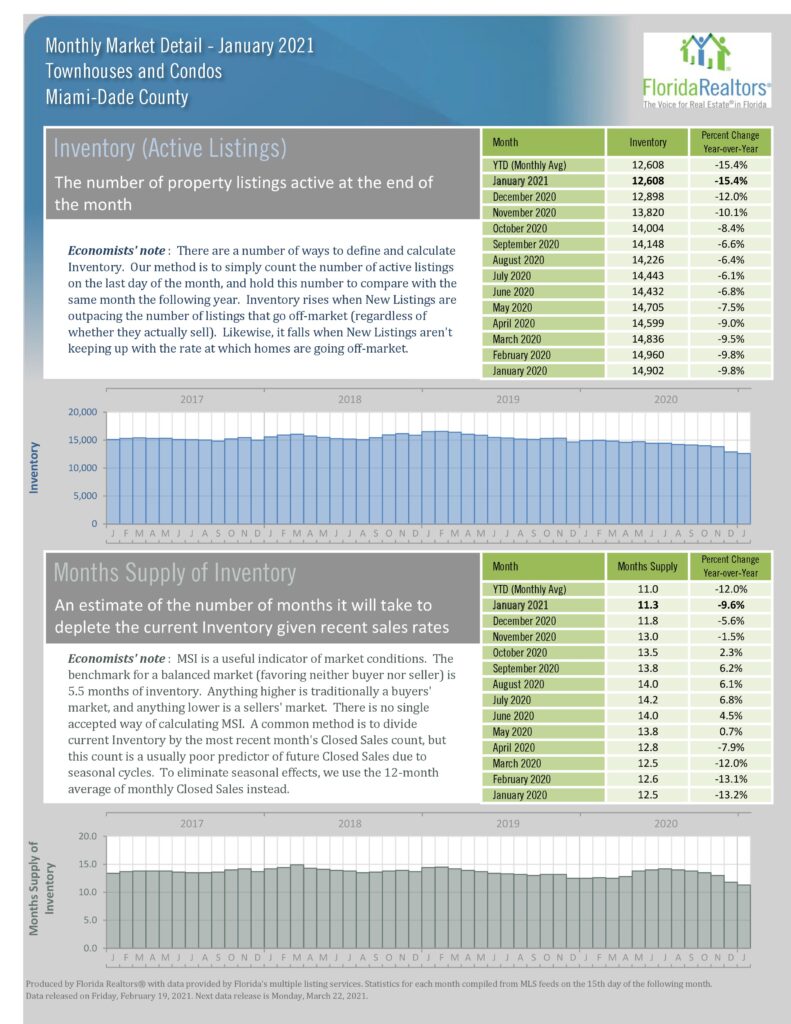
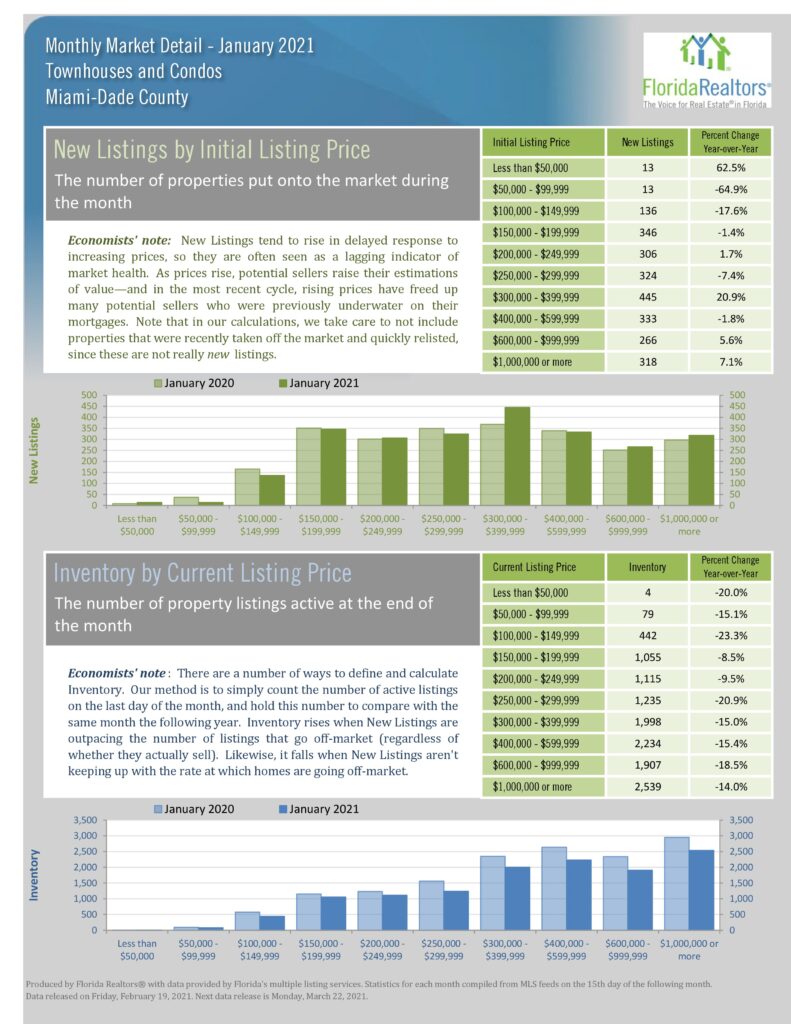
  • Inventory (# of listings)
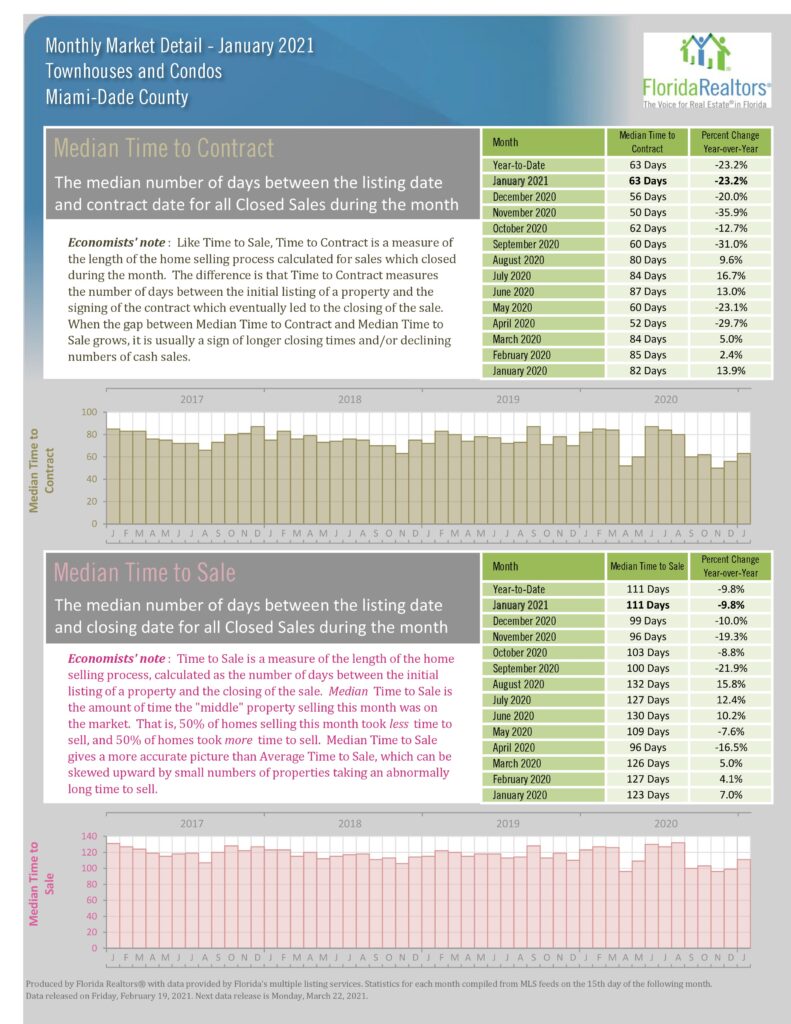
    • Condos Down 15.4%
    • SFH Down 45.8%

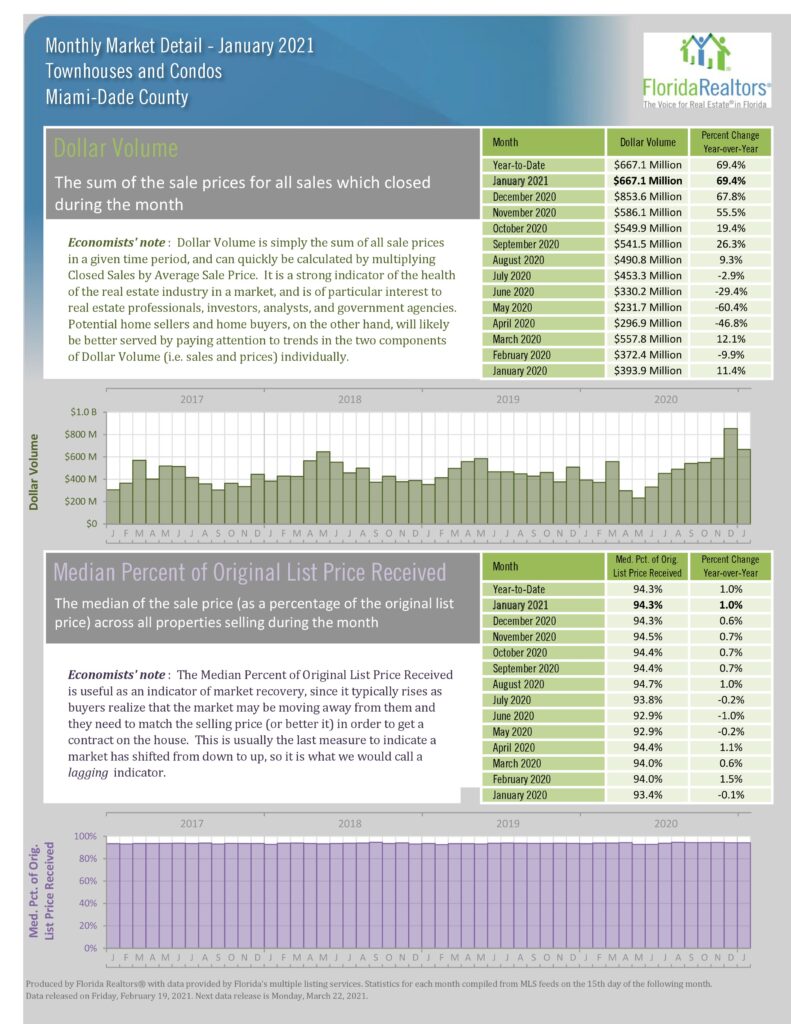
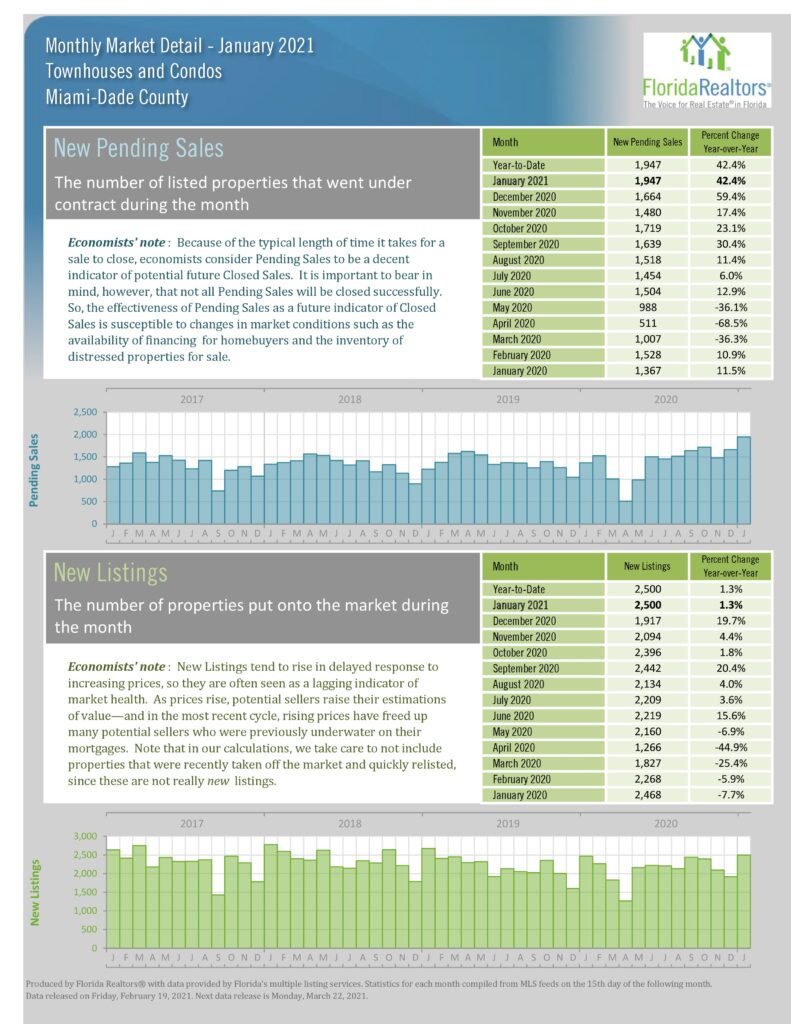
The Miami Market is on fire! Compared to a year ago condo sales are up 28.1% with dollar volume up 69.4%.  Pending sales are up 43.1% with listing inventory down 15.4%. Single Family inventory is down 45.8% causing a spike in the average sale price which is up 70.8%. Supply and Demand Principles are unquestionably at play. The Miami market which relied heavily on International Buyers is experiencing a major shift to Domestic Buyers escaping high taxes, pursuing a high quality of life and having the ability to work remotely, and we’re seeing great interest from the Tech and Financial industries. Many home buyers are now considering condos as a viable alternative. Click below for my article on this subject in Miami Herald.
Stay safe and be well.
We’re here to serve you.
Statistics about traditional, foreclosure/REO, and short sales. One is done over closed sales percentages. The other is done over median sale price. Statistics chart for new listing by initial listing price and inventory by current listing price. Statistics chart for closed sales by sale price and median time to contract by sale price. Statistics chart for inventory (active listings) and month’s supply of inventory. Both have year-to-date (monthly average) and monthly statistics. Statistics chart for new pending sales and new listings. Both have year-to-date and monthly statistics. Statistics chart for median time to contract and median time to sale. Both have year-to-date and monthly statistics. Statistics chart for dollar volume price and median percent of original list price. Both have year-to-date and monthly statistics. Statistics chart for median sale price and average sale price. Both have year-to-date and monthly statistics. Statistics chart for cash sales and cash sales as a percentage of closed sales. Both have year-to-date and monthly statistics. Summary statistics for all September statistics. Close sales statistics chart, with monthly changes and year-to-date numbers.

Share:

Copyright ©. No guarantee, warranty or representation of any kind is made regarding the completeness or accuracy of descriptions or measurements including but not limited to square footage, room count, number of bedrooms, or designated school, and should be independently verified and expressly disclaim any liability in connection therewith. While, information from this website including market statistic data is believed to be correct, it is represented subject to errors, omissions, changes or withdrawal without notice. All material presented herein is intended for information purposes only. No financial or legal advice provided. Equal Housing Opportunity.