Miami Real Estate Report, July 2021 Statistics

KEY NUMBERS (Compared to July 2020)

  • Number of Condo Sales Up 103.7% YTD 122.7%
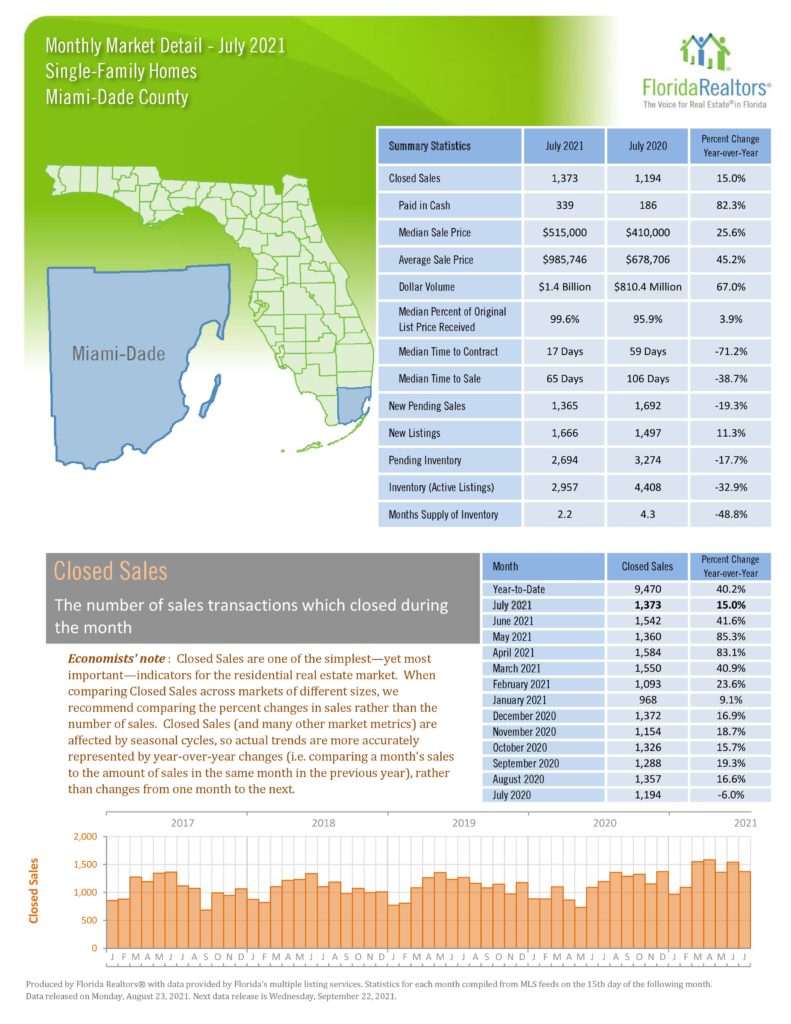
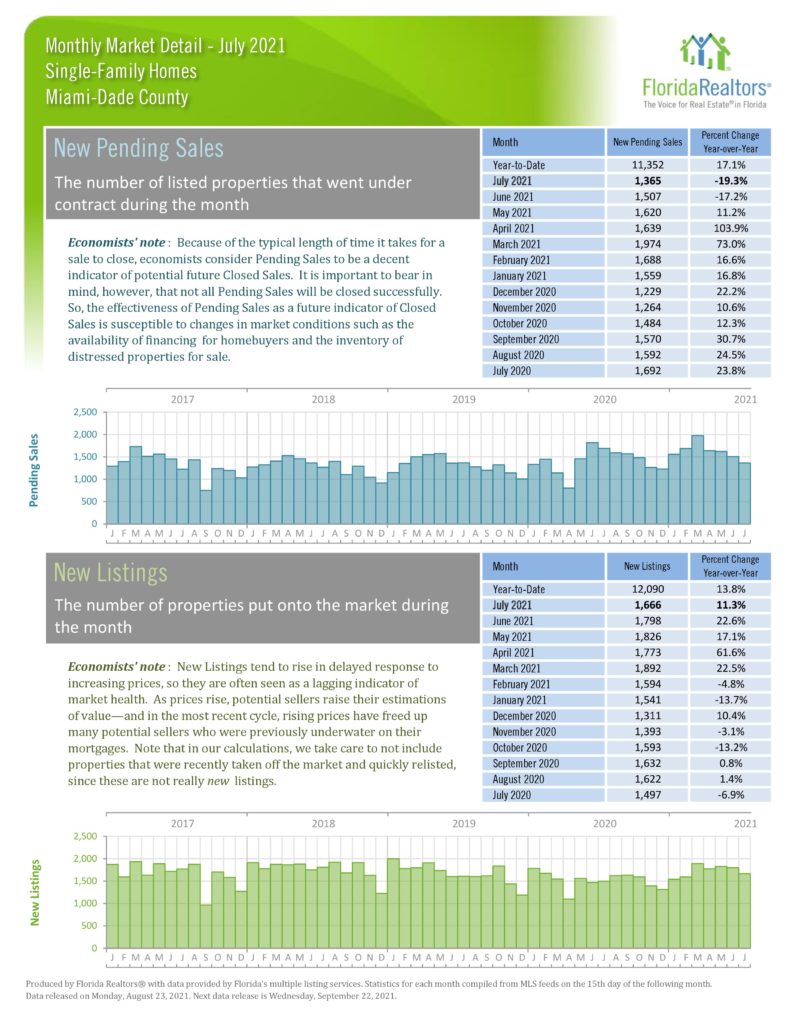
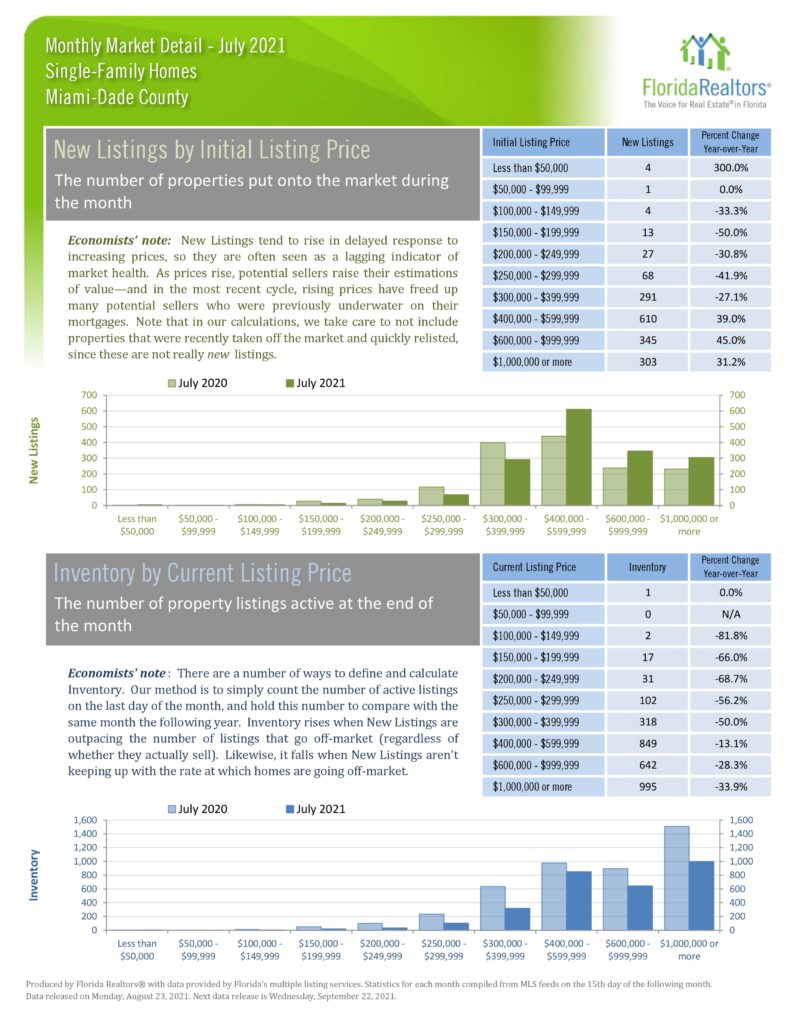
  • Number of Single Family Sales Up 15% YTD 40%
  • Median  Condo Price – Up 30.8% YTD 23.1%
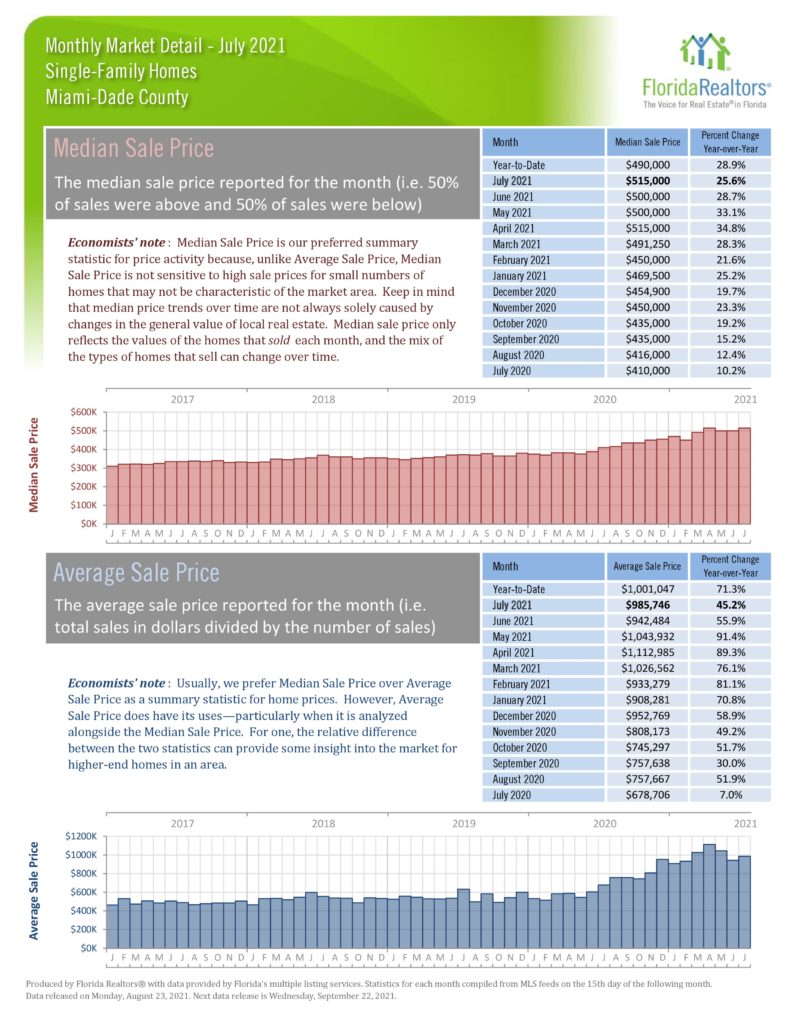
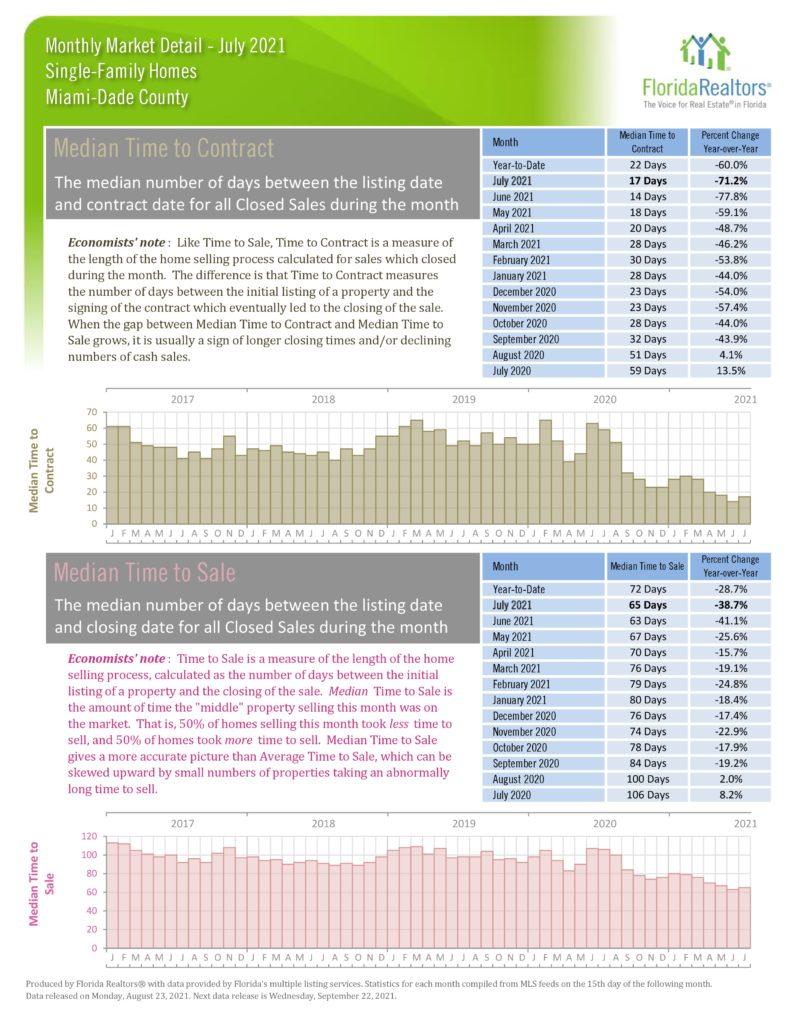
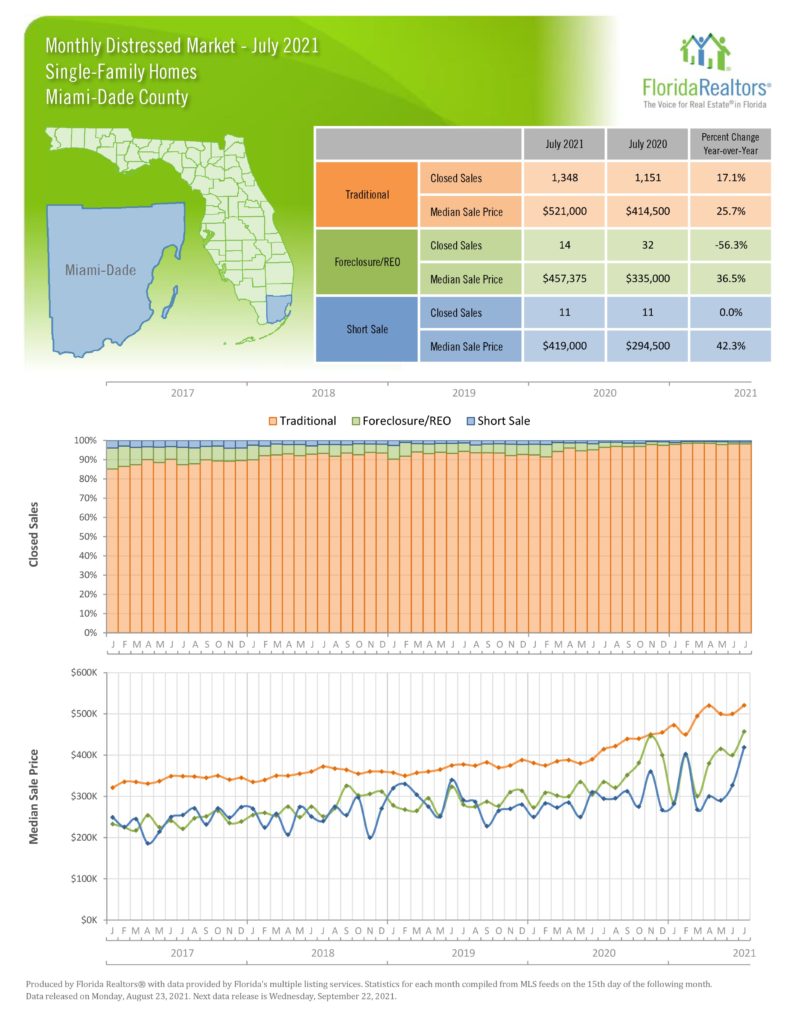
  • Median Single Family Price Up 25.6% YTD 21%
  • Closed Dollar Volume
    • Condos: $1.3billion Up 187%
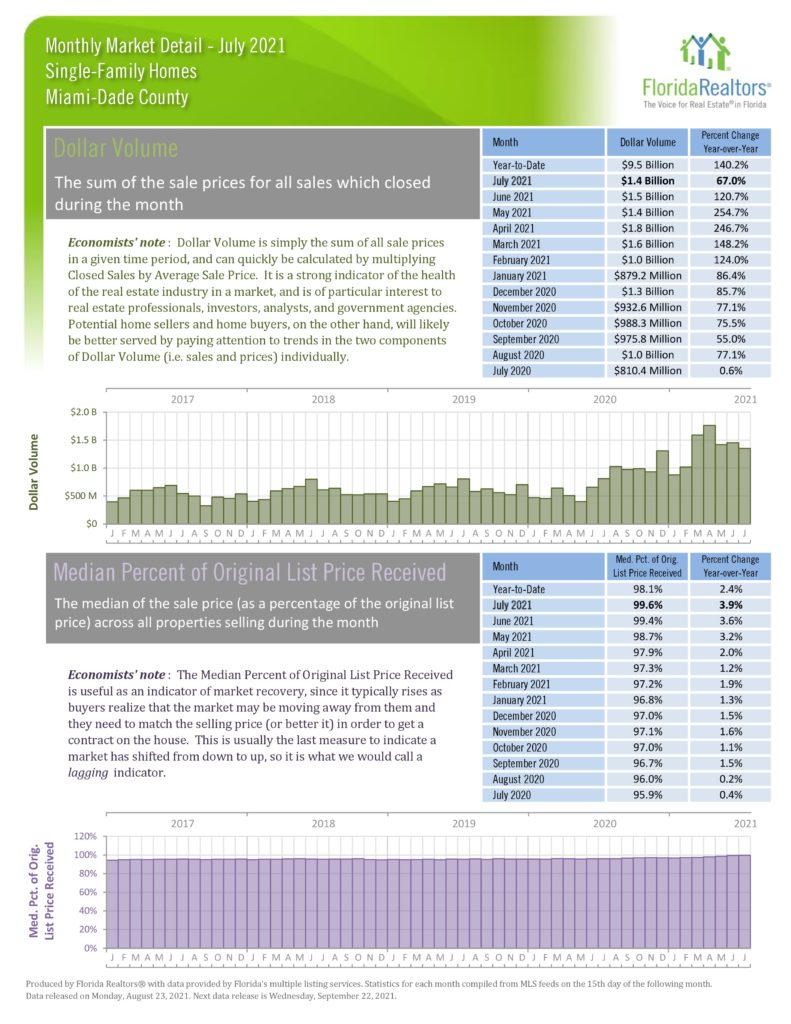
    • SFH: $1.4billion Up 67%

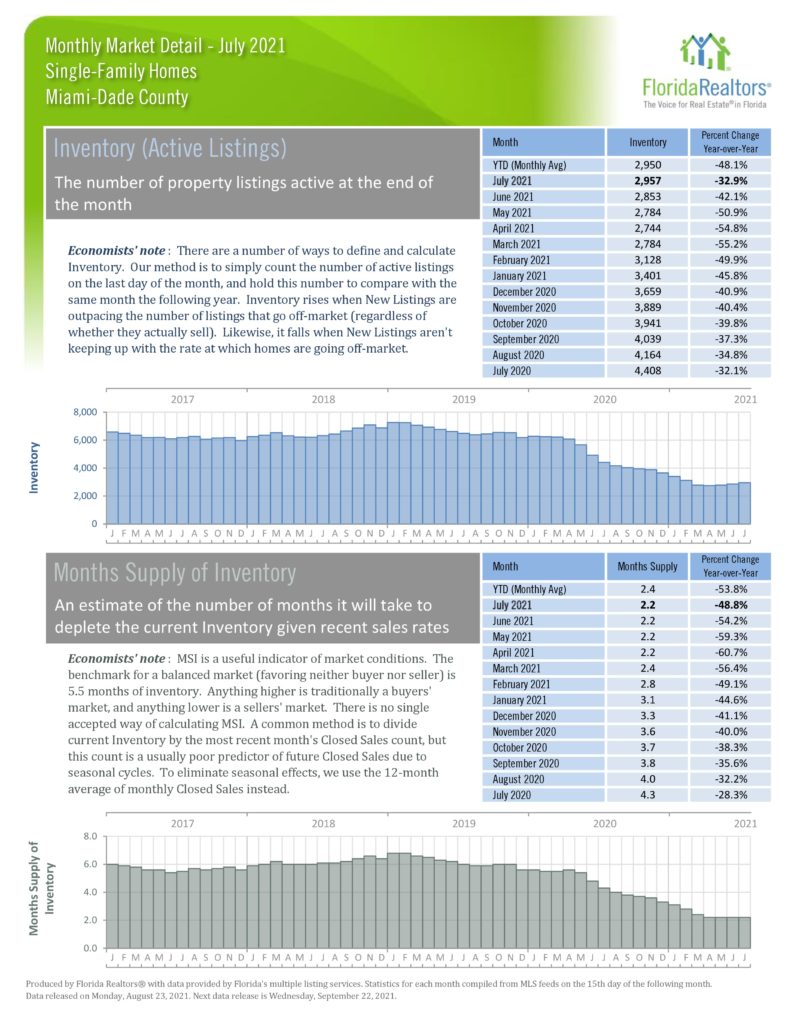
Compared to July last year all the numbers are up except inventory and month’s supply. With such demand and tight supply prices are doing what would be expected. Condo median price up 30.8% – Single Family up 25.6%. Number of  Condo sales up 103.7% and dollar volume up 187% but comparing to July 2019 – pre-pandemic – the numbers are still strong, sales up 85% and volume up 178%.
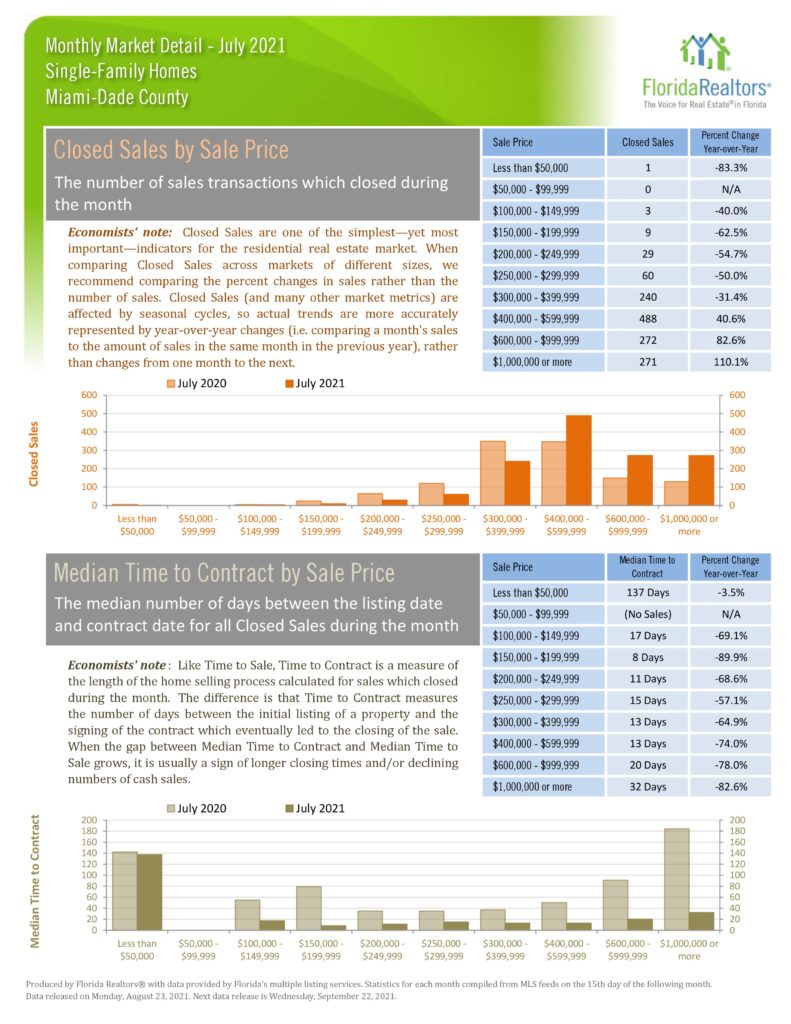
Single Family numbers are strong but not as exaggerated as condos as the single family market was hot before the condo craze kicked in. Buyers are buying higher priced properties. Condos sales over $1 million were up 323% and Single Family sales up 110%. There is strong demand for Miami real estate from the Tech and Finance industries, people looking to pay less in taxes and those in search of a great quality of life…. It’s here!

Next Report for August Statistics will be September 22, 2021
Call us for Professional Real Estate Services – For All Your Real Estate Needs: 305-695-1105

Statistics about traditional, foreclosure/REO, and short sales. One is done over closed sales percentages. The other is done over median sale price.Statistics about traditional, foreclosure/REO, and short sales. One is done over closed sales percentages. The other is done over median sale price.

Statistics chart for new listing by initial listing price and inventory by current listing price.

Statistics chart for closed sales by sale price and median time to contract by sale price.

Statistics chart for inventory (active listings) and month’s supply of inventory. Both have year-to-date (monthly average) and monthly statistics.

Statistics chart for new pending sales and new listings. Both have year-to-date and monthly statistics.

Statistics chart for median time to contract and median time to sale. Both have year-to-date and monthly statistics.

Statistics chart for dollar volume price and median percent of original list price. Both have year-to-date and monthly statistics.

Statistics chart for median sale price and average sale price. Both have year-to-date and monthly statistics.

Statistics chart for cash sales and cash sales as a percentage of closed sales. Both have year-to-date and monthly statistics.

Summary statistics for all September statistics. Close sales statistics chart, with monthly changes and year-to-date numbers.

Share:

Copyright ©. No guarantee, warranty or representation of any kind is made regarding the completeness or accuracy of descriptions or measurements including but not limited to square footage, room count, number of bedrooms, or designated school, and should be independently verified and expressly disclaim any liability in connection therewith. While, information from this website including market statistic data is believed to be correct, it is represented subject to errors, omissions, changes or withdrawal without notice. All material presented herein is intended for information purposes only. No financial or legal advice provided. Equal Housing Opportunity.