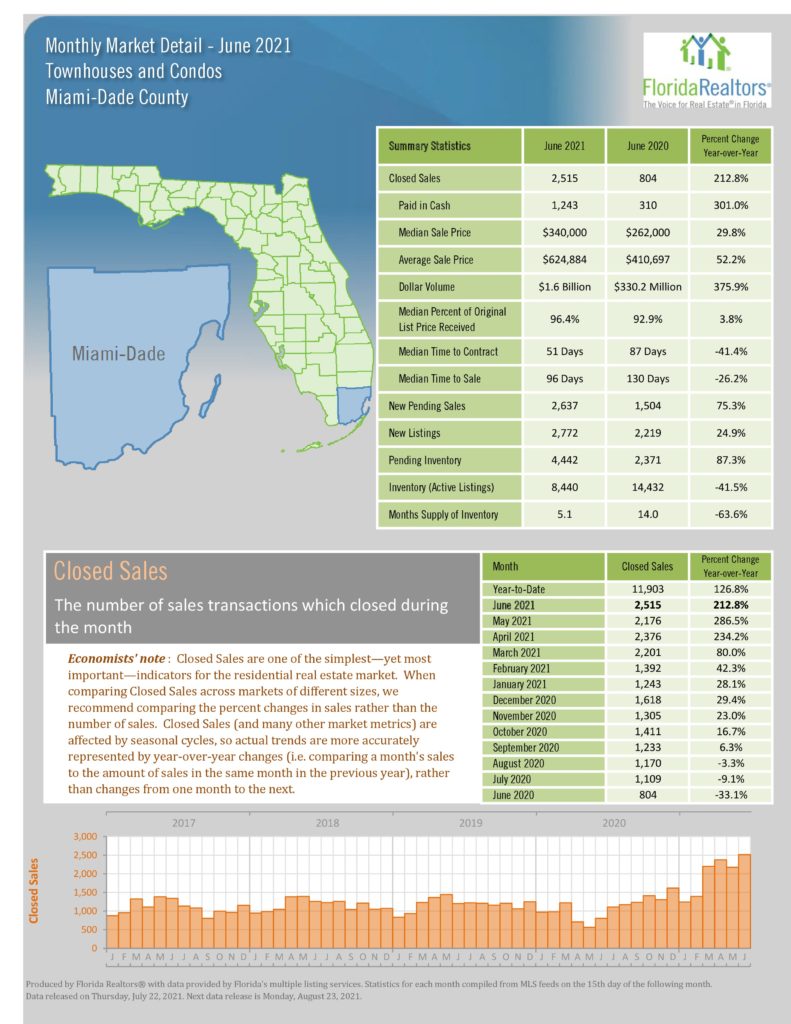
Miami Real Estate Report, June 2021 Statistics

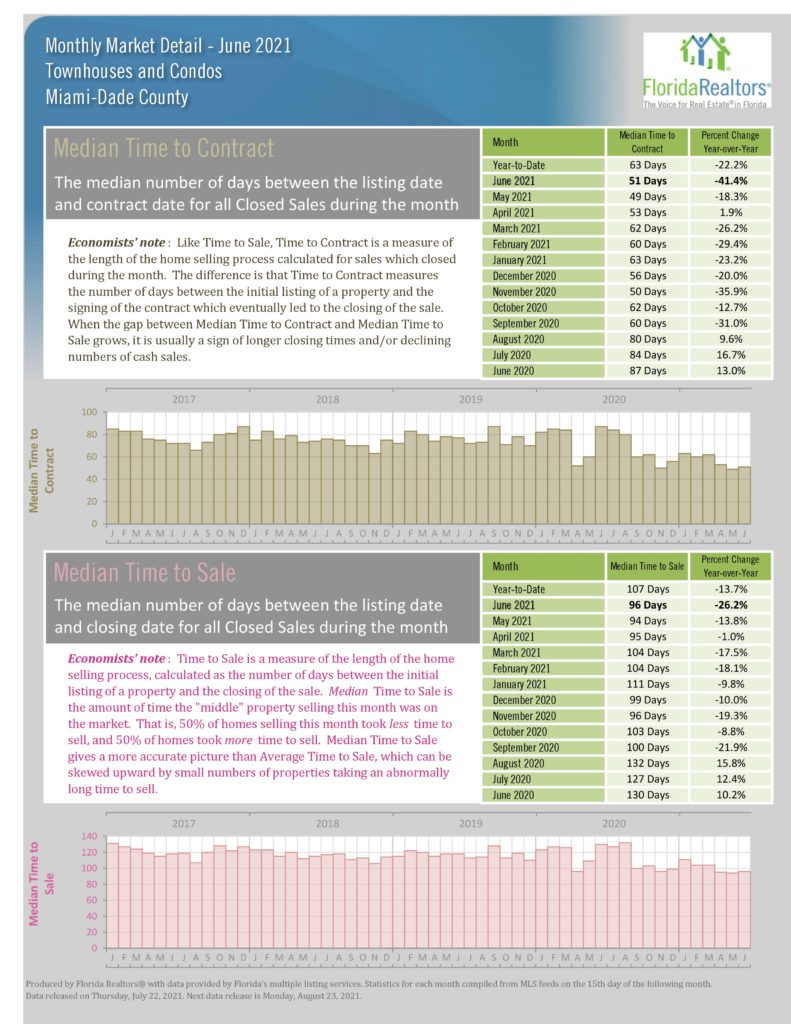
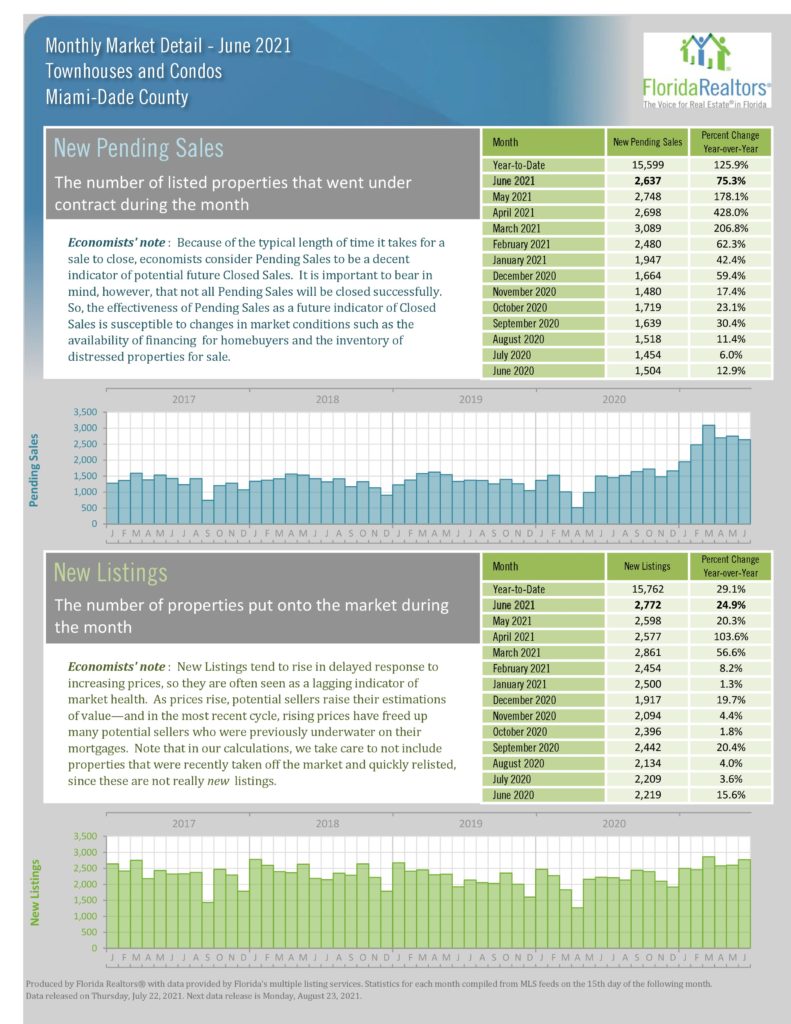
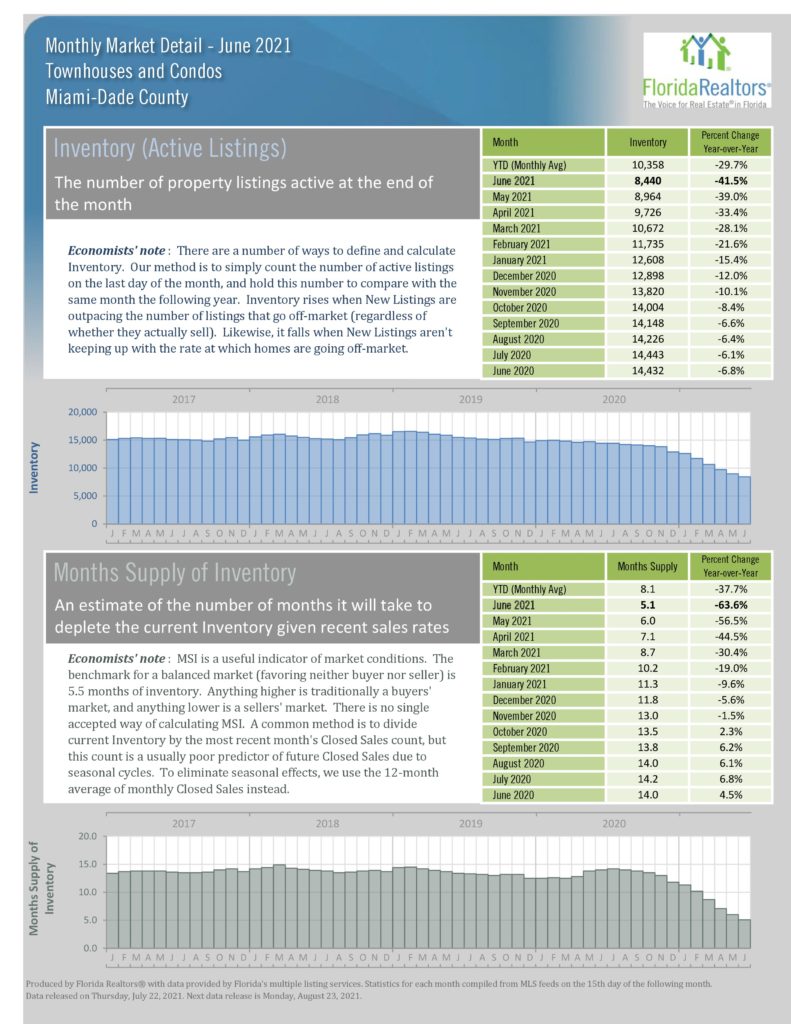
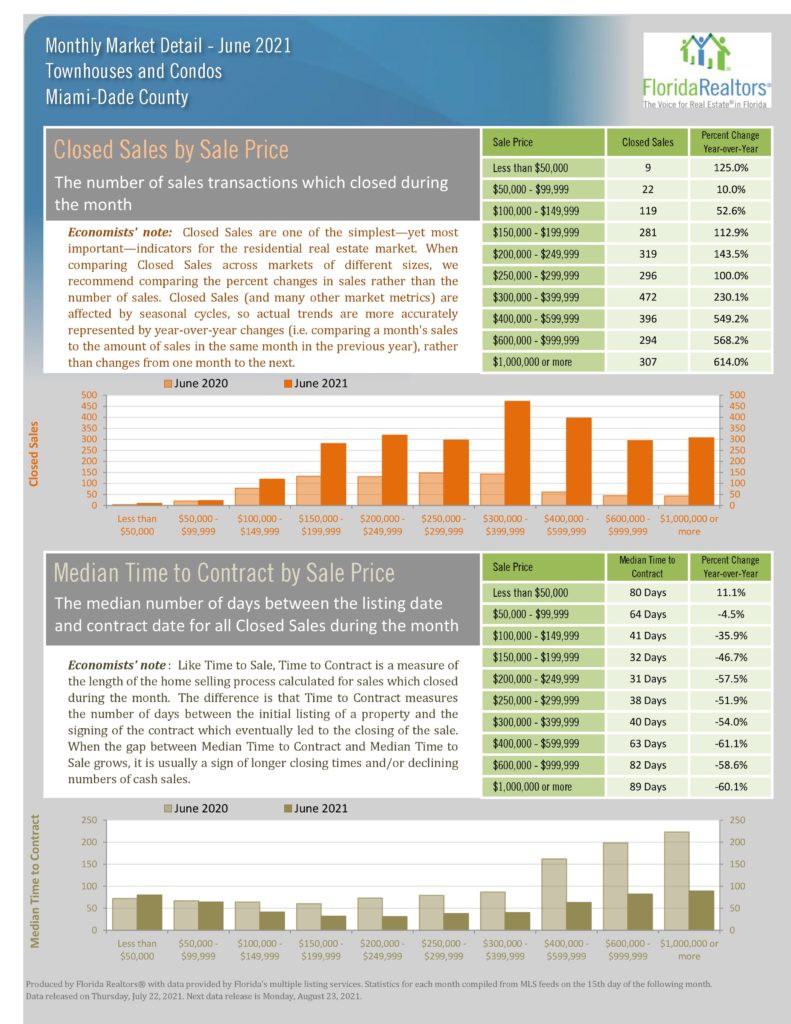
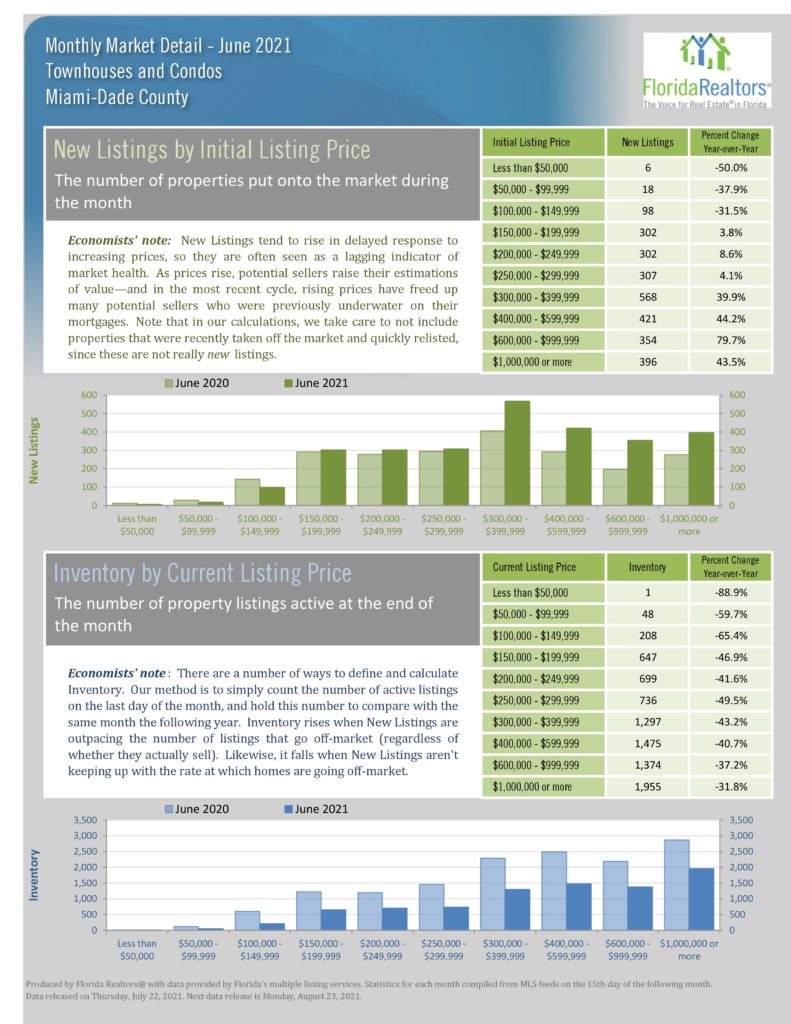
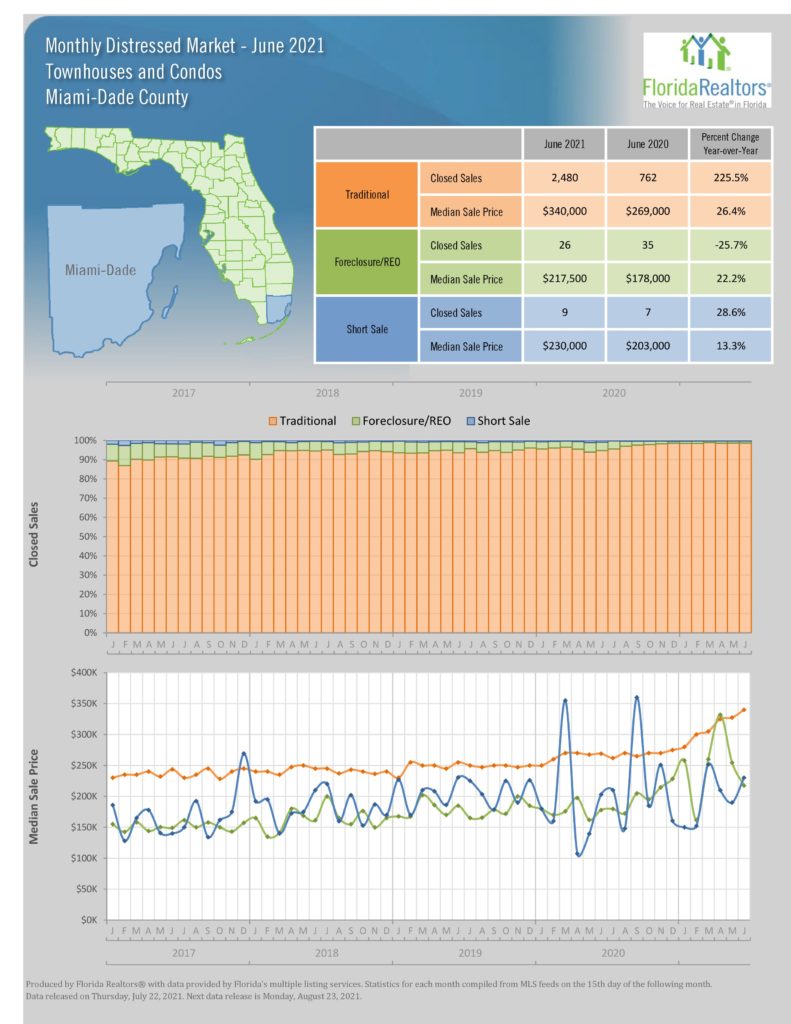
Compared to last year the numbers are booming. Condo sales up 212.8% and dollar volume up 376%but comparing to June 2019 – pre-pandemic – the numbers are still strong, sales up more than double and volume up 2.5 times.  Single Family numbers are strong but not as exaggerated as condos as the single family market was hot before the condo craze kicked in. There is strong demand for Miami real estate . It’s a Seller’s market with low inventory and high demand. Buyers are buying higher priced properties. Condos sales over $1 million were up 614% and Single Family sales up 253%. Median prices for both condos and single family were up close to 30% but keep in mind that this is a reflection of higher priced properties being sold. We anticipate a continued strong market with a possible slower pace.

KEY NUMBERS (Compared to June 2020)
  • Number of Condo Sales Up 212.8% YTD 127%
  • Number of Single Family Sales Up 41.6% YTD 46%
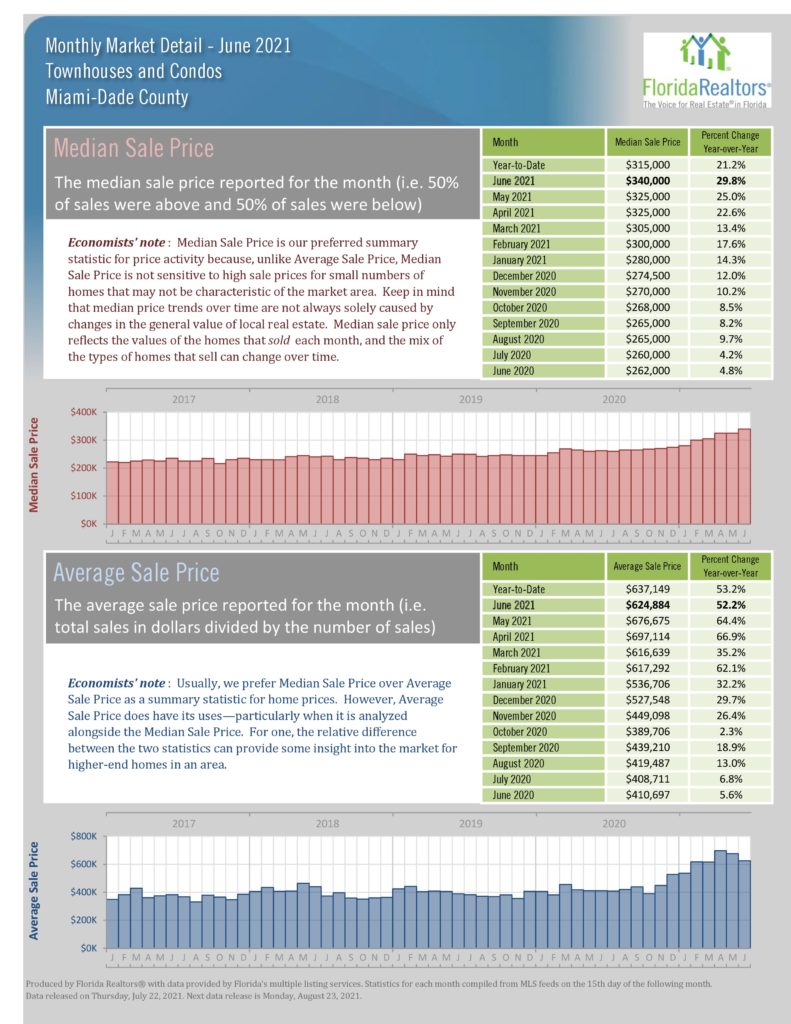
  • Median  Condo Price – Up 28.7% YTD 28.3%
  • Median Single Family Price Up 30% YTD 21%
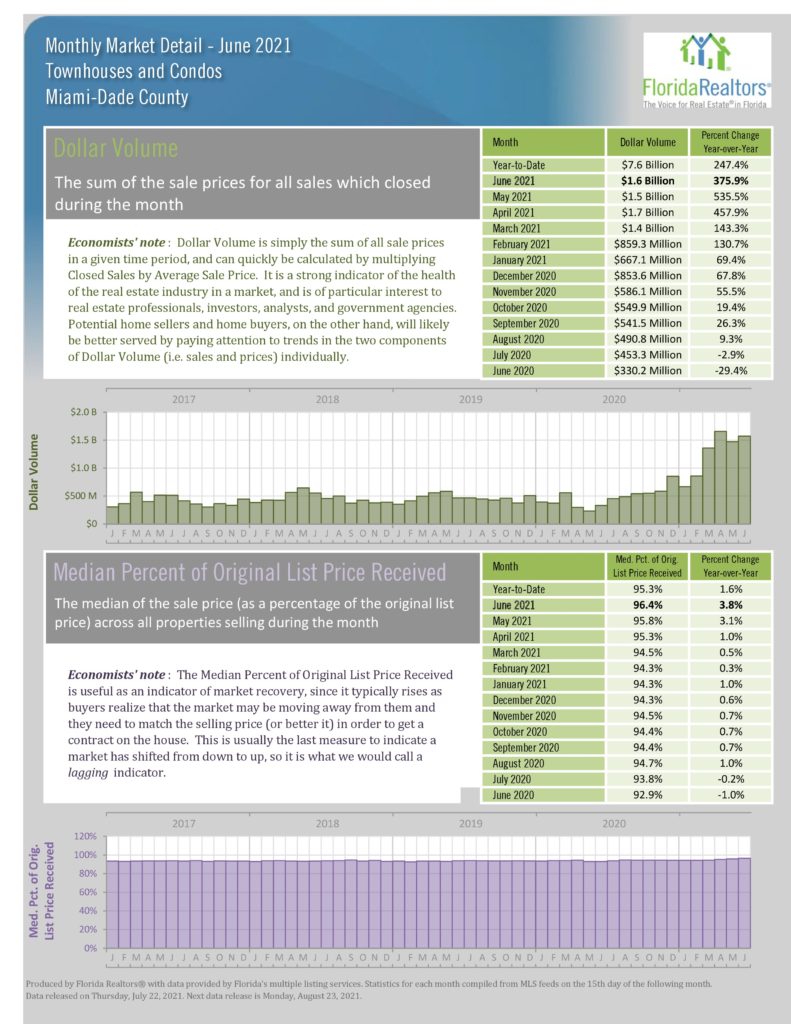
  • Closed Dollar Volume
    • Condos – $1.6billion Up 376%
    • SFH – $1.5billion Up 121%

Statistics about traditional, foreclosure/REO, and short sales. One is done over closed sales percentages. The other is done over median sale price.

Statistics chart for new listing by initial listing price and inventory by current listing price.

Statistics chart for closed sales by sale price and median time to contract by sale price.

Statistics chart for inventory (active listings) and month’s supply of inventory. Both have year-to-date (monthly average) and monthly statistics.

Statistics chart for new pending sales and new listings. Both have year-to-date and monthly statistics.

Statistics chart for median time to contract and median time to sale. Both have year-to-date and monthly statistics.

Statistics chart for dollar volume price and median percent of original list price. Both have year-to-date and monthly statistics.

Statistics chart for median sale price and average sale price. Both have year-to-date and monthly statistics.

Statistics chart for cash sales and cash sales as a percentage of closed sales. Both have year-to-date and monthly statistics.

Summary statistics for all September statistics. Close sales statistics chart, with monthly changes and year-to-date numbers.

Share:

Copyright ©. No guarantee, warranty or representation of any kind is made regarding the completeness or accuracy of descriptions or measurements including but not limited to square footage, room count, number of bedrooms, or designated school, and should be independently verified and expressly disclaim any liability in connection therewith. While, information from this website including market statistic data is believed to be correct, it is represented subject to errors, omissions, changes or withdrawal without notice. All material presented herein is intended for information purposes only. No financial or legal advice provided. Equal Housing Opportunity.