Miami Real Estate Report, March 2021 Statistics

KEY NUMBERS (Compared to March 2020)
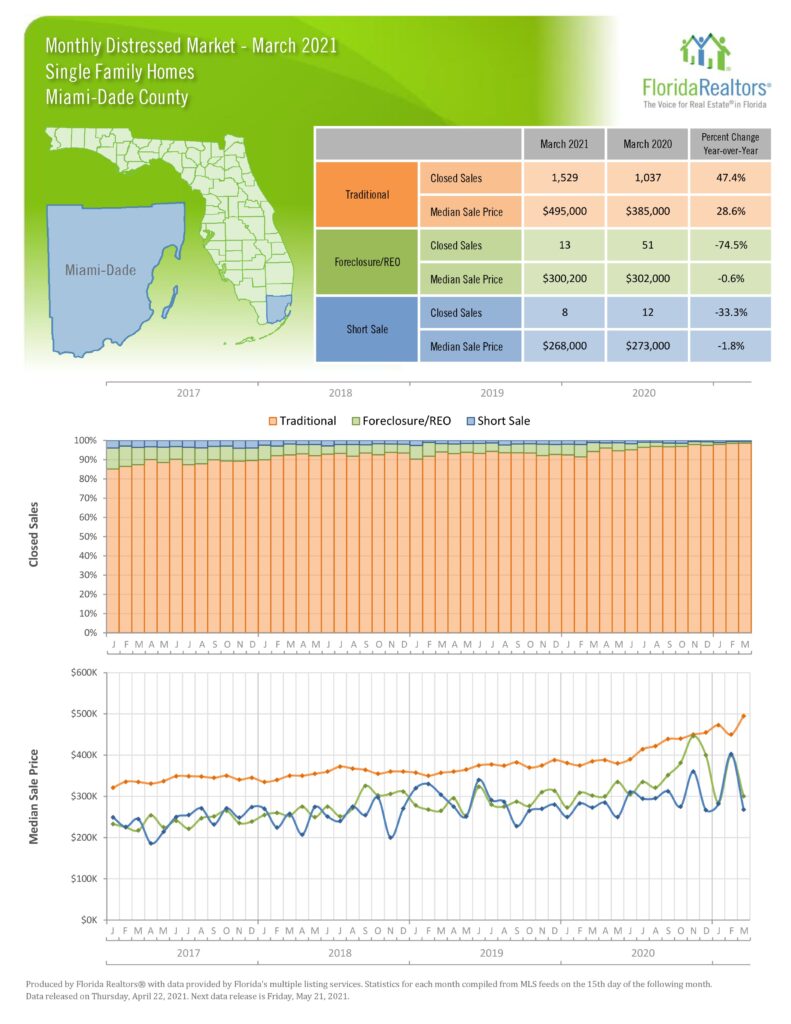
  • Number of Condo Sales Up 80%
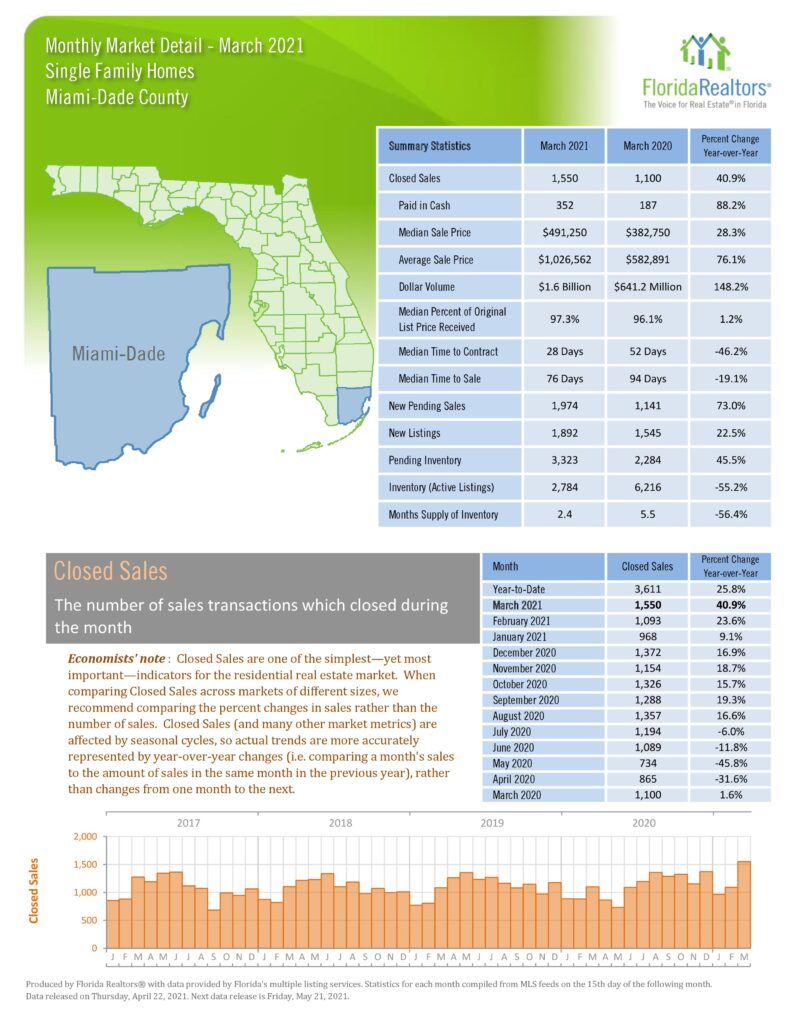
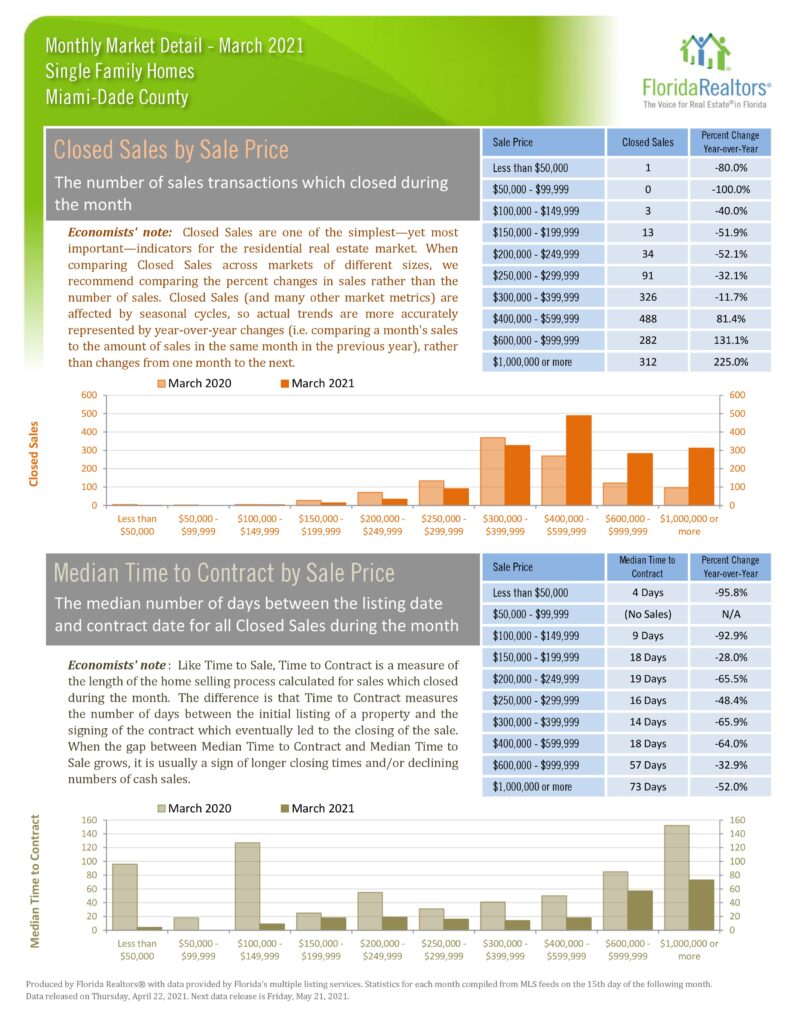
  • Number of Single Family Sales Up 40.9%
  • Median  Condo Price – Up 13.4%
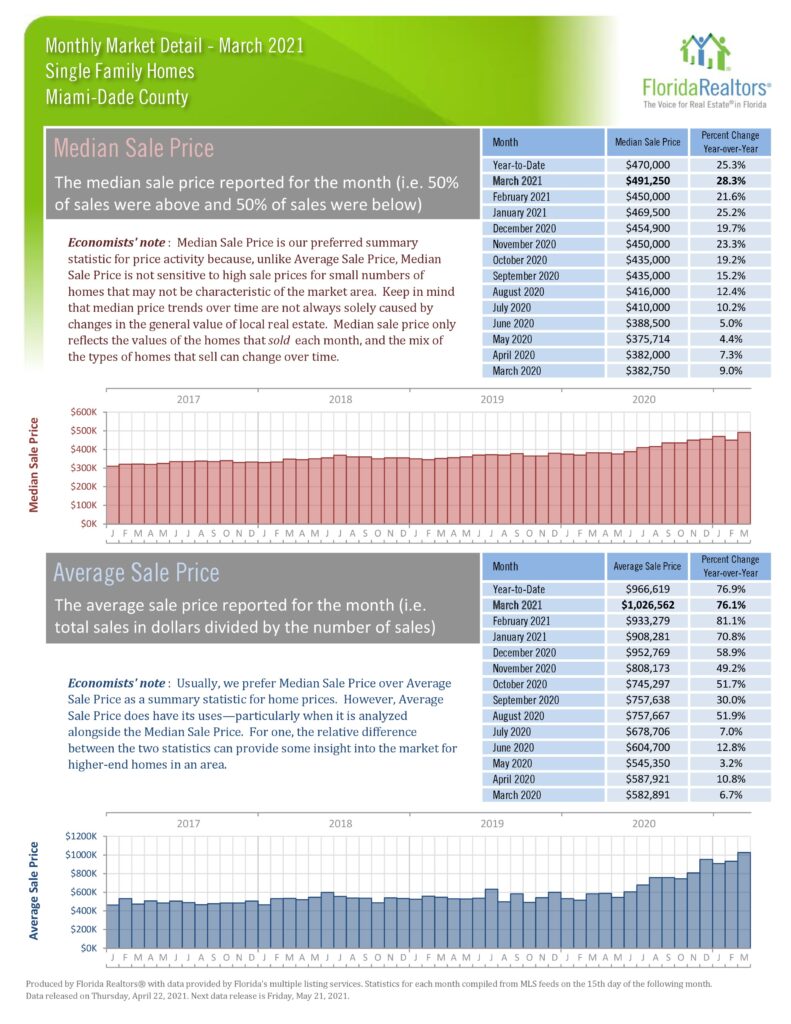
  • Median Single Family Price Up 28.3%
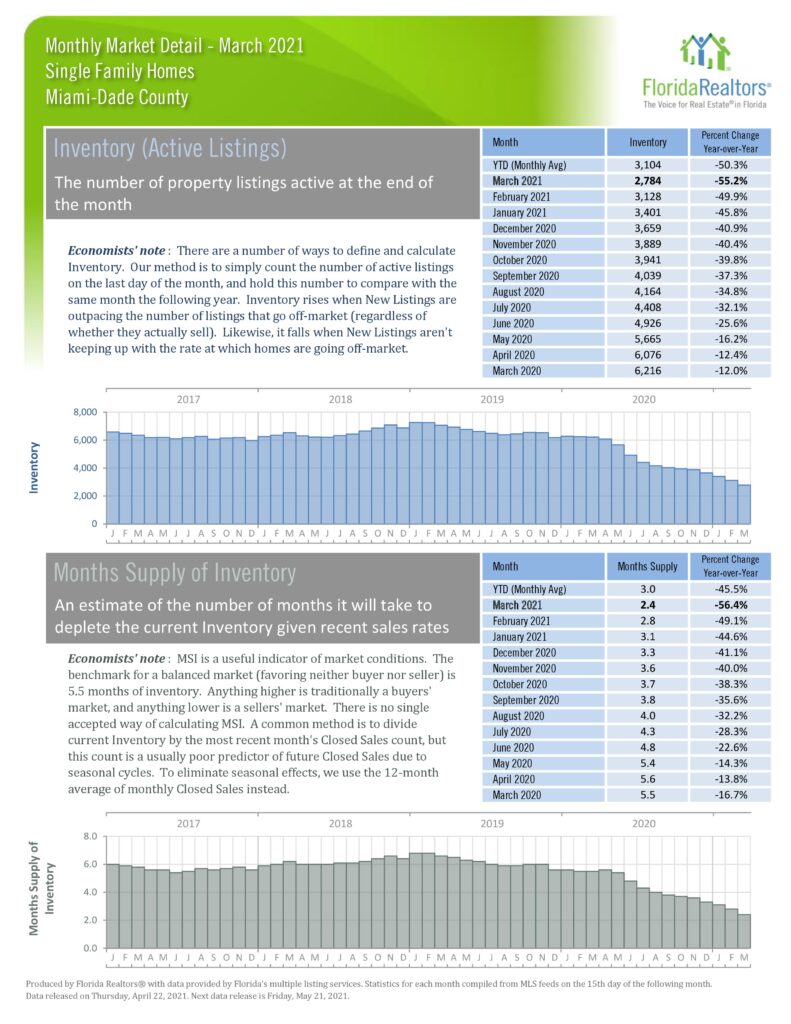
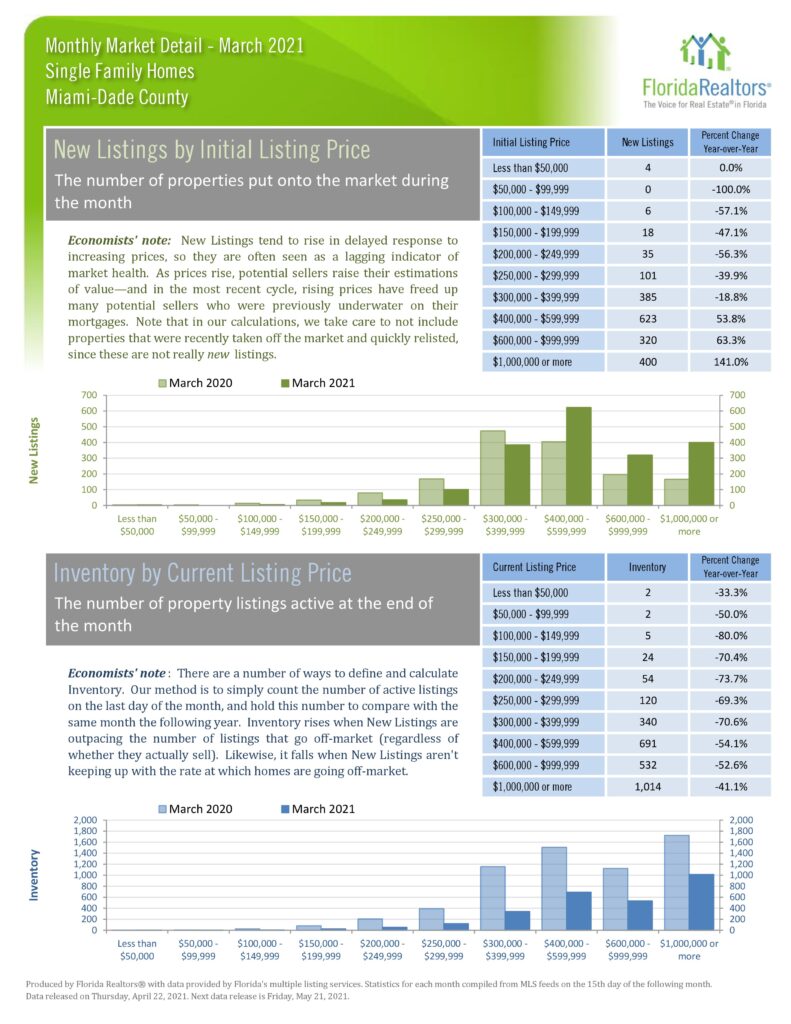
  • Inventory (# of listings)
    • Condos Down 28.1%
    • SFH Down 55.2%

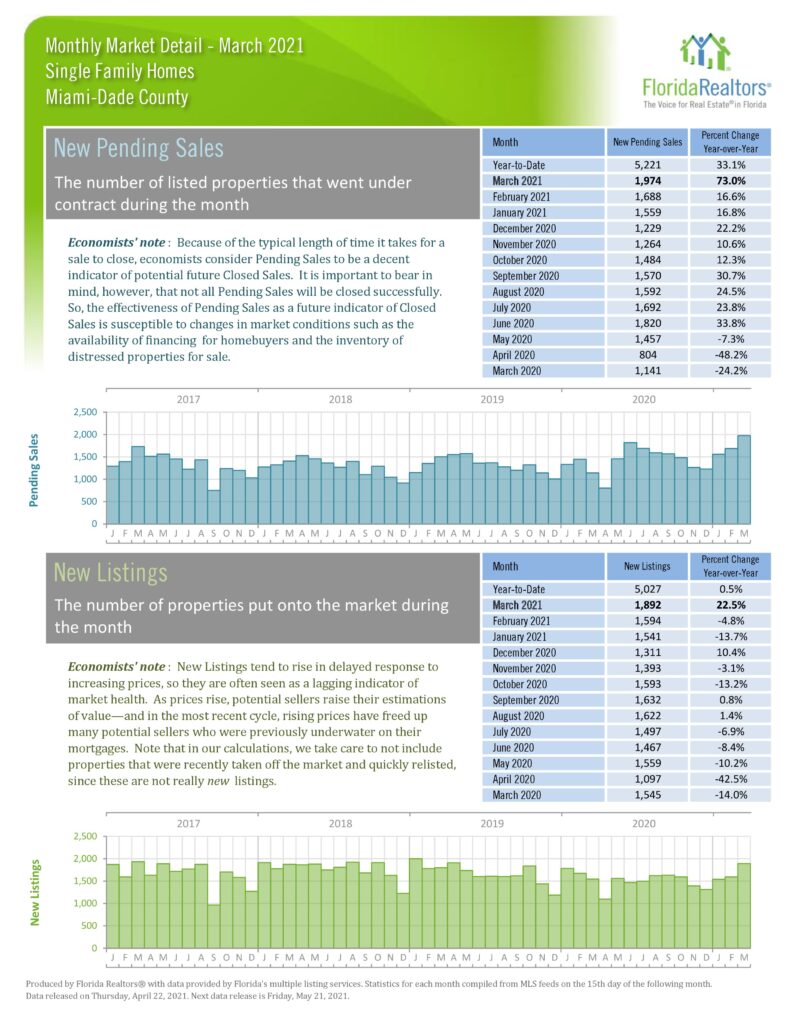
The money is coming to Miami!
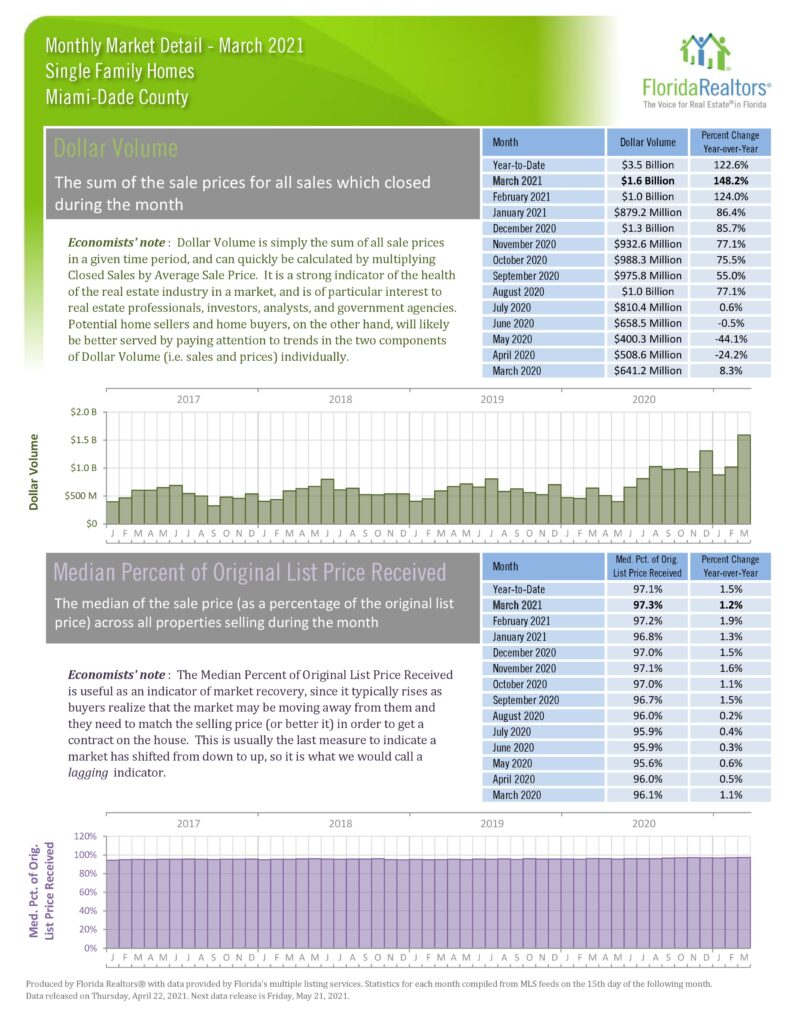
Condo sales are up 80%, Single Family up 41% with a combined Dollar Volume of $3 Billion – close to 150% increase over last March. New Pending Condo Sales are up 206.8% indicating the strength of the current market and future increases in closed sales. Single Family New Pendings are up 73%. The market come back is in full gear reminiscent of the come backs starting in 2002 and again after the recession in 2012. So much of the sales activity is from domestic buyers being drawn here for the high quality of life, no income taxes and the new normal of working remotely.  With less travel restrictions coming, International Buyers will soon be here too. It’s time to buy and a great time to sell.

Statistics about traditional, foreclosure/REO, and short sales. One is done over closed sales percentages. The other is done over median sale price. Statistics chart for new listing by initial listing price and inventory by current listing price. Statistics chart for closed sales by sale price and median time to contract by sale price. Statistics chart for inventory (active listings) and month’s supply of inventory. Both have year-to-date (monthly average) and monthly statistics. Statistics chart for new pending sales and new listings. Both have year-to-date and monthly statistics. Statistics chart for median time to contract and median time to sale. Both have year-to-date and monthly statistics. Statistics chart for dollar volume price and median percent of original list price. Both have year-to-date and monthly statistics. Statistics chart for median sale price and average sale price. Both have year-to-date and monthly statistics. Statistics chart for cash sales and cash sales as a percentage of closed sales. Both have year-to-date and monthly statistics. Summary statistics for all September statistics. Close sales statistics chart, with monthly changes and year-to-date numbers.

Share:

Copyright ©. No guarantee, warranty or representation of any kind is made regarding the completeness or accuracy of descriptions or measurements including but not limited to square footage, room count, number of bedrooms, or designated school, and should be independently verified and expressly disclaim any liability in connection therewith. While, information from this website including market statistic data is believed to be correct, it is represented subject to errors, omissions, changes or withdrawal without notice. All material presented herein is intended for information purposes only. No financial or legal advice provided. Equal Housing Opportunity.