Miami Real Estate Report, May 2021 Statistics

These numbers compared to last year are astronomical but keep in mind that last year was down considerably from 2019 because of COVID. May 2020 condo sales were down 61% from 2019 but 2021 sales are up 51% from 2019 which is a major increase. 2020 condo dollar volume was down 60% from 2019 but 2021 volume is up 156% from 2019, another strong showing of a ultra-strong market. Single family 2020 closed sales were down 46% form 2019. 2021 was flat compared to 2019, but May 2021 dollar volume is up 96% from 2019. There is strong demand for Miami real estate and huge amounts of money are pouring in. Most industry insiders believe this trend will continue but at a slower pace. It’s time to buy and a great time to sell.

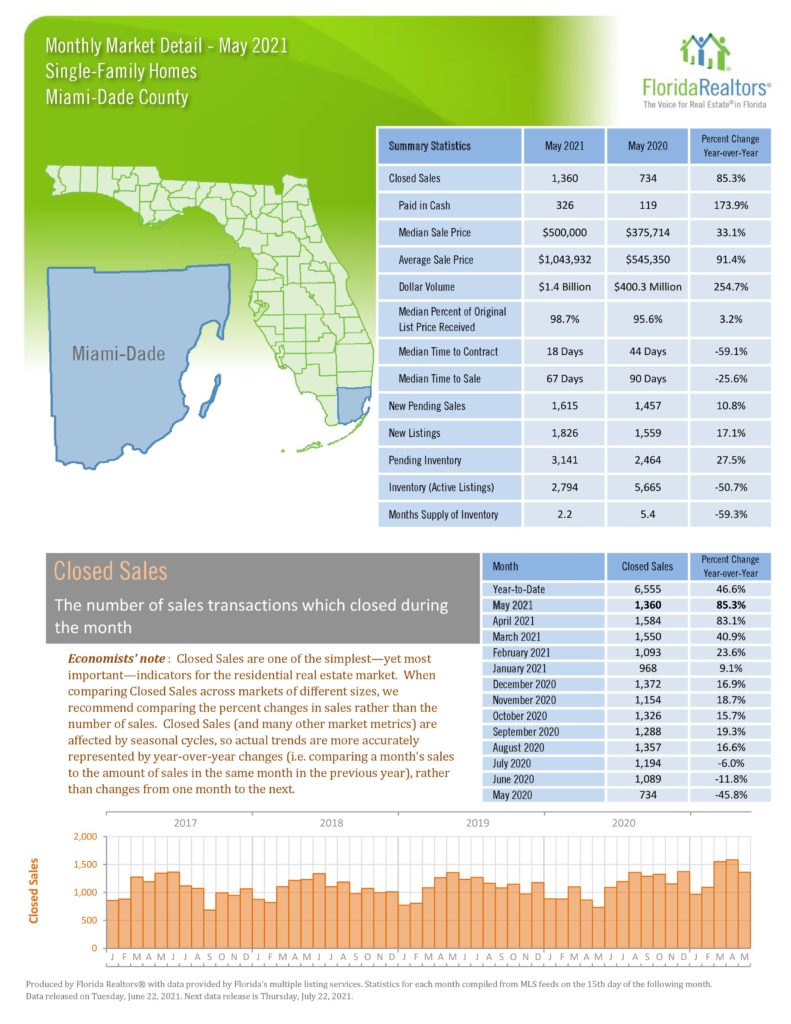
KEY NUMBERS (Compared to May 2020)
  • Number of Condo Sales Up 286.5% YTD 111%
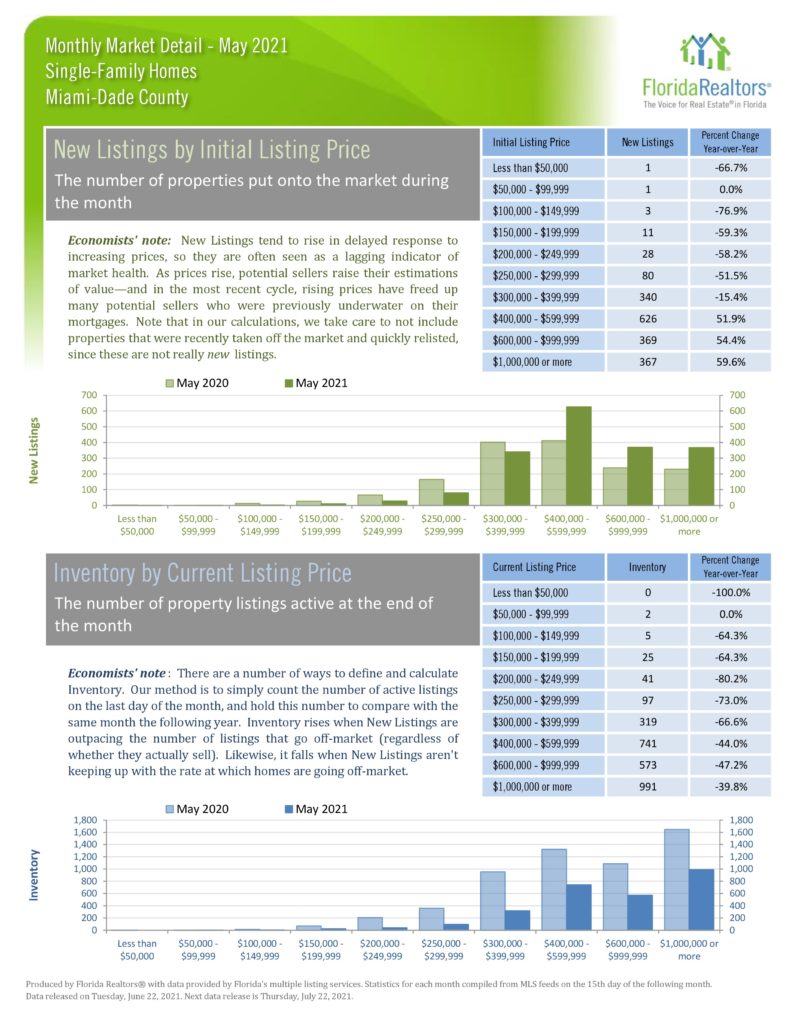
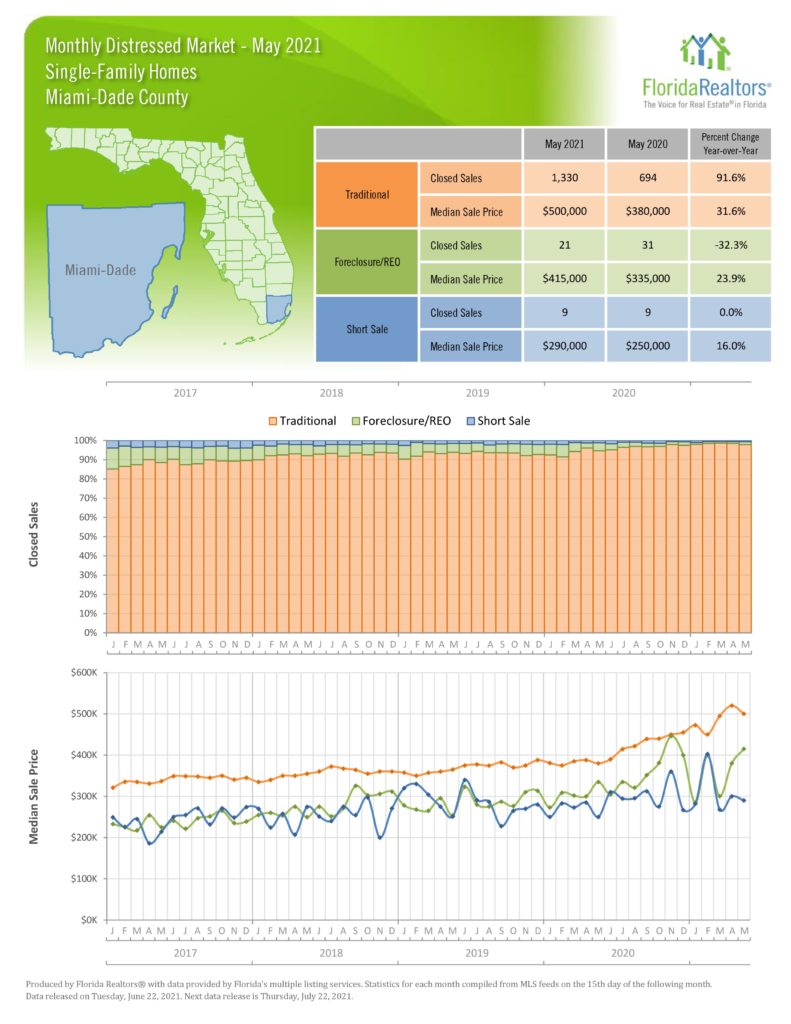
  • Number of Single Family Sales Up 85% YTD 47%
  • Median Condo Price – Up 25% YTD 19.2%
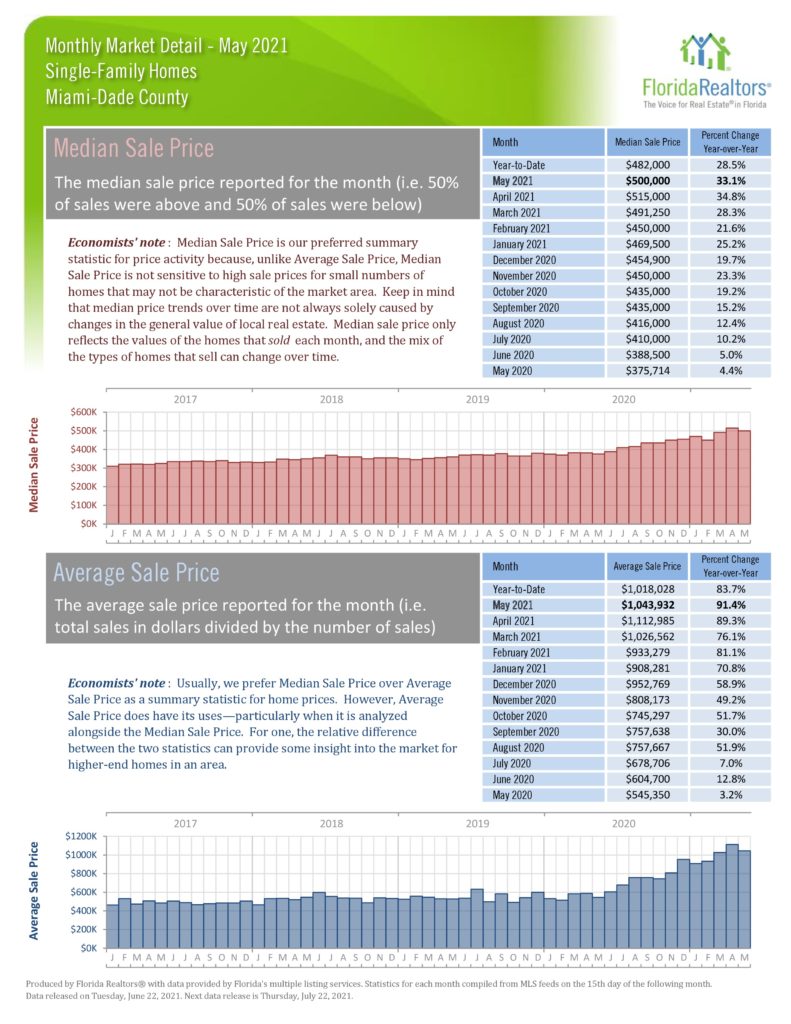
  • Median Single Family Price Up 33% YTD 28%
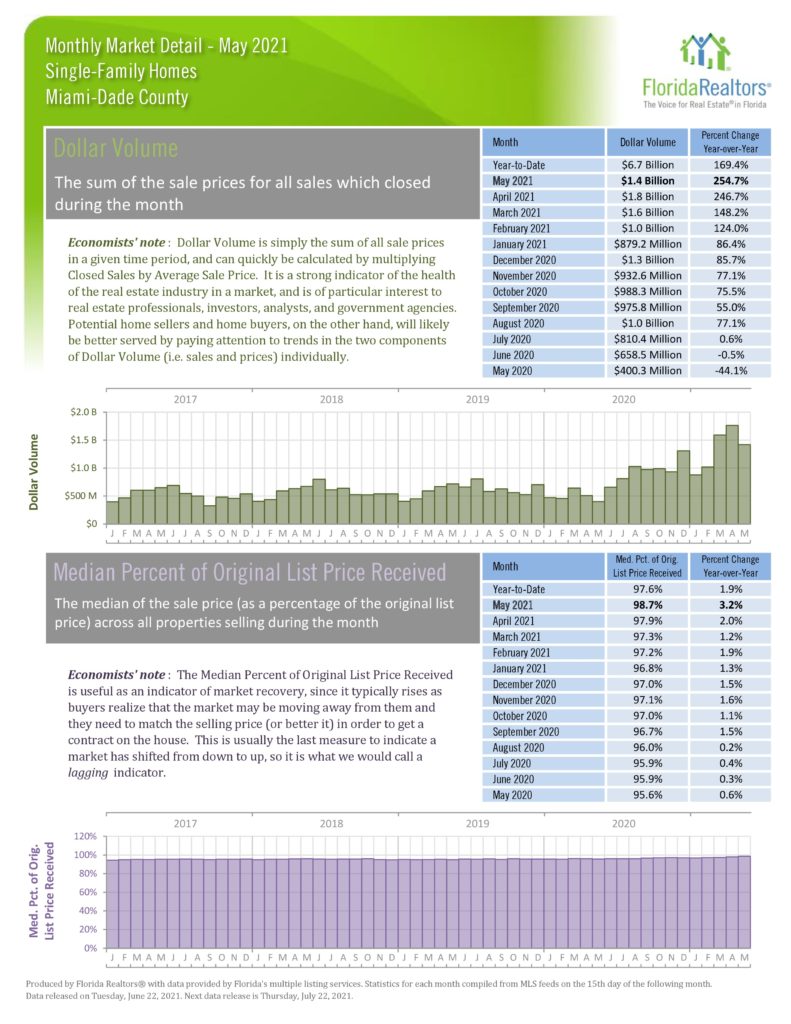
  • Closed Dollar Volume
    • Condos $1.5billion Up 535%
    • SFH $1.4billion Up 255%

Statistics about traditional, foreclosure/REO, and short sales. One is done over closed sales percentages. The other is done over median sale price. Statistics chart for new listing by initial listing price and inventory by current listing price. Statistics chart for closed sales by sale price and median time to contract by sale price. Statistics chart for inventory (active listings) and month’s supply of inventory. Both have year-to-date (monthly average) and monthly statistics. Statistics chart for new pending sales and new listings. Both have year-to-date and monthly statistics. Statistics chart for median time to contract and median time to sale. Both have year-to-date and monthly statistics. Statistics chart for dollar volume price and median percent of original list price. Both have year-to-date and monthly statistics. Statistics chart for median sale price and average sale price. Both have year-to-date and monthly statistics. Statistics chart for cash sales and cash sales as a percentage of closed sales. Both have year-to-date and monthly statistics. Summary statistics for all September statistics. Close sales statistics chart, with monthly changes and year-to-date numbers.

Share:

Copyright ©. No guarantee, warranty or representation of any kind is made regarding the completeness or accuracy of descriptions or measurements including but not limited to square footage, room count, number of bedrooms, or designated school, and should be independently verified and expressly disclaim any liability in connection therewith. While, information from this website including market statistic data is believed to be correct, it is represented subject to errors, omissions, changes or withdrawal without notice. All material presented herein is intended for information purposes only. No financial or legal advice provided. Equal Housing Opportunity.