Miami Real Estate Report, November 2020 Statistics

KEY NUMBERS (Compared to November 2019)

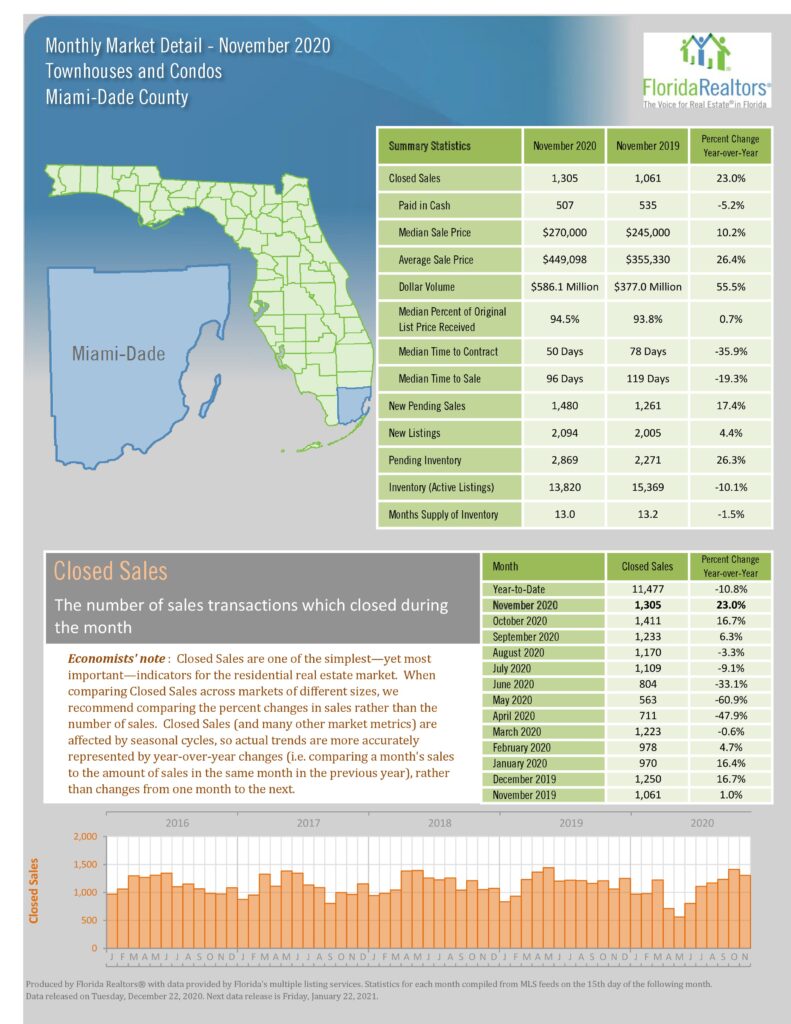
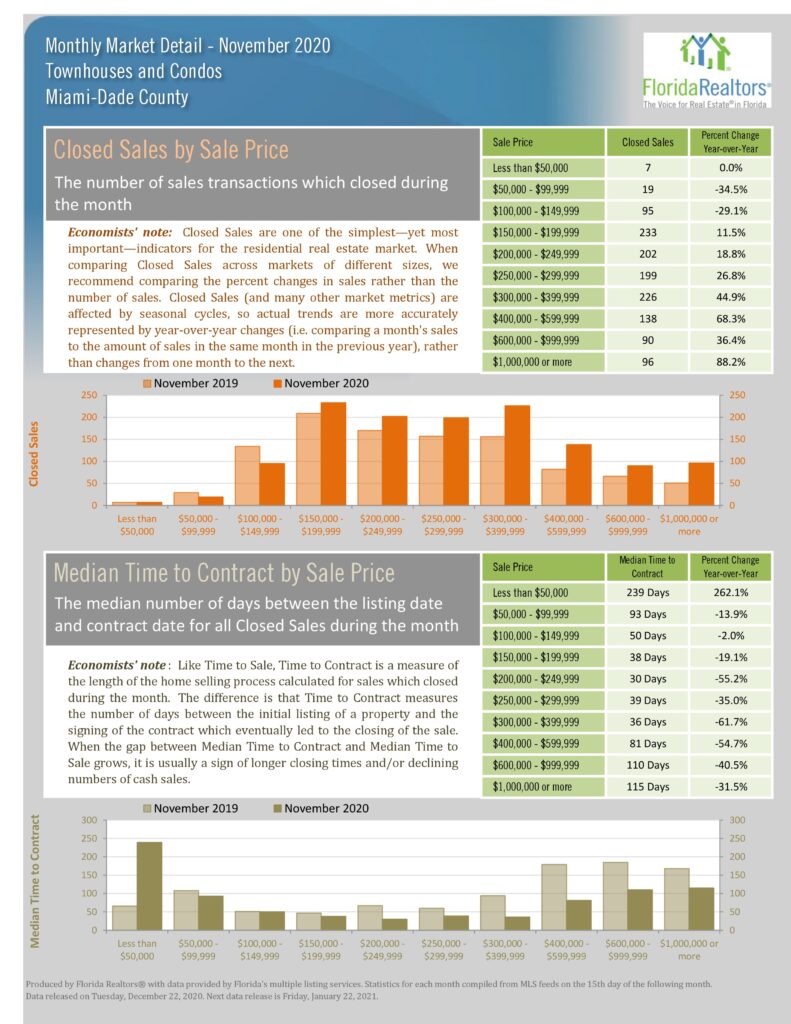
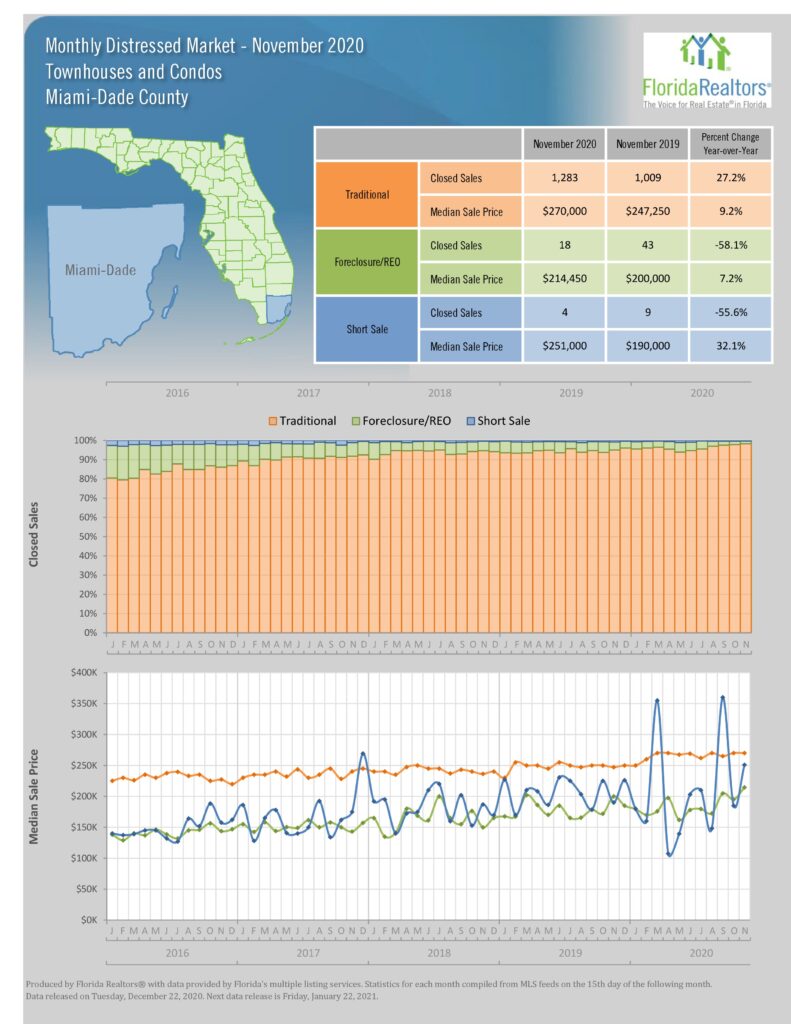
  • Number of Condo Sales Up 23%
  • Number of Single Family Sales Up 18.7%
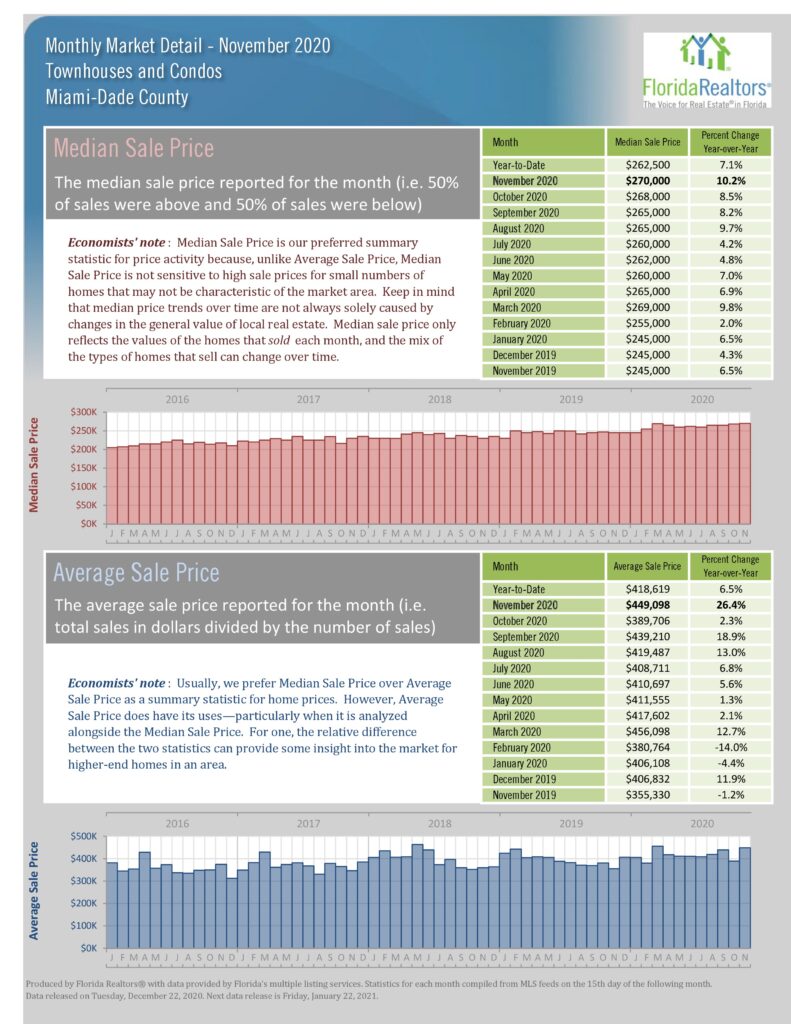
  • Median Condo Price – Up 10.2%
  • Median Single Family Price Up 23.3%
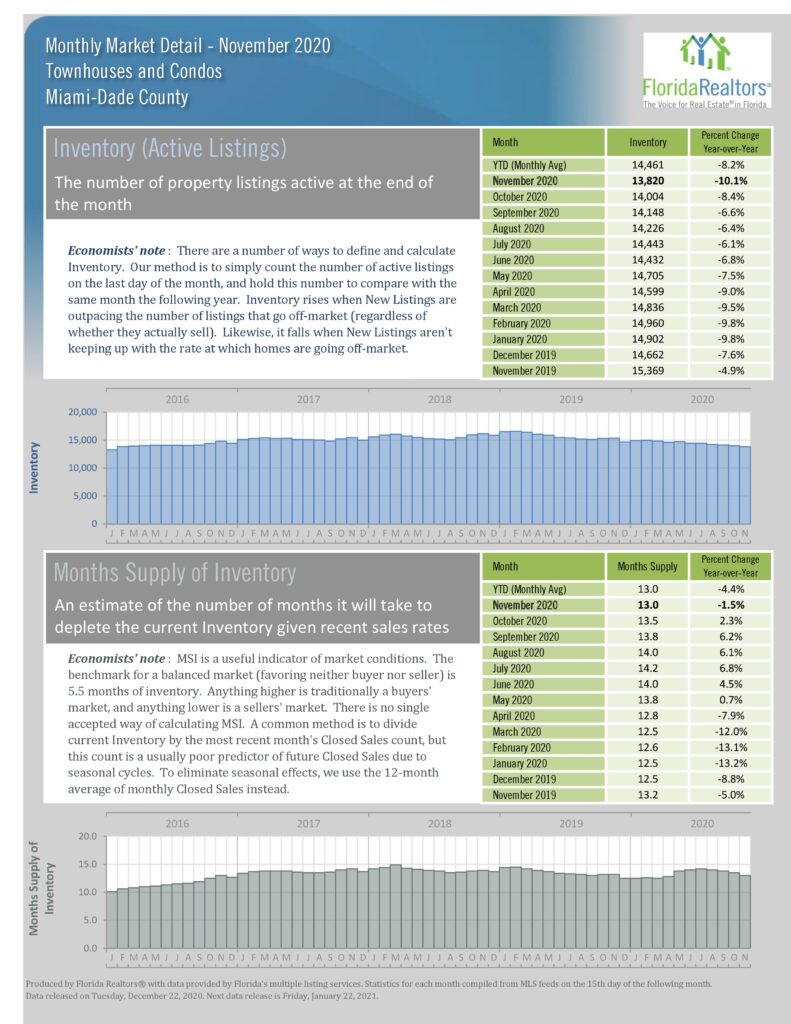
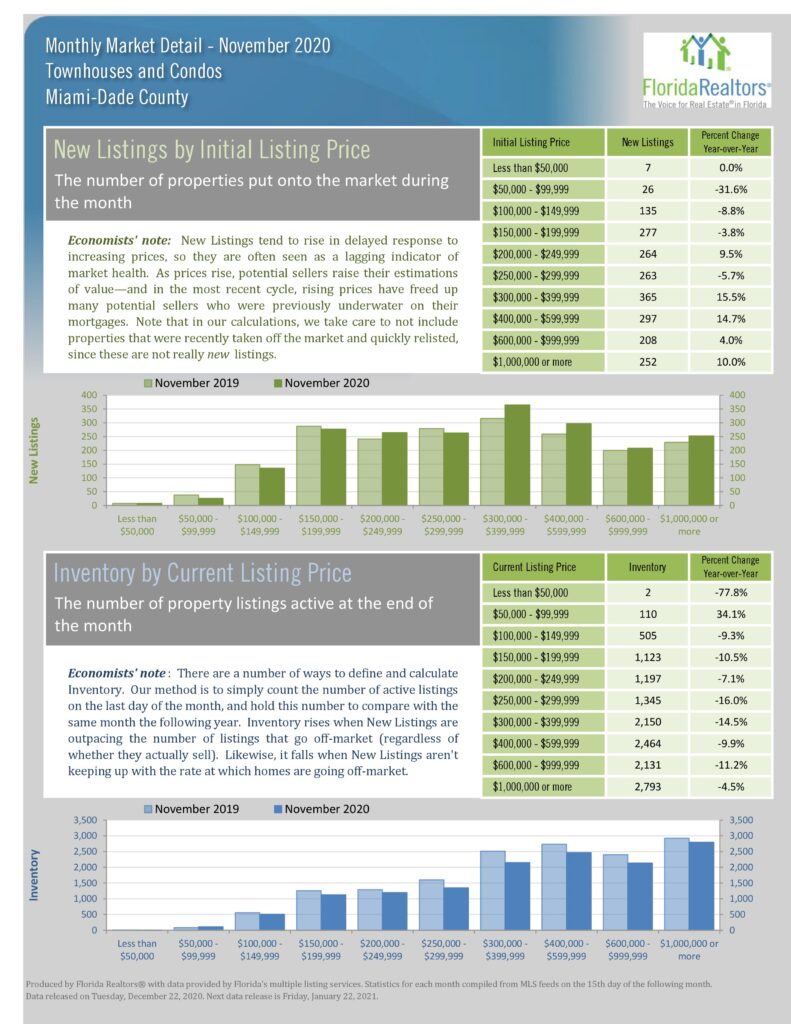
  • Inventory (# of listings)
    • Condos Down 10.1%
    • SFH Down 40.4%

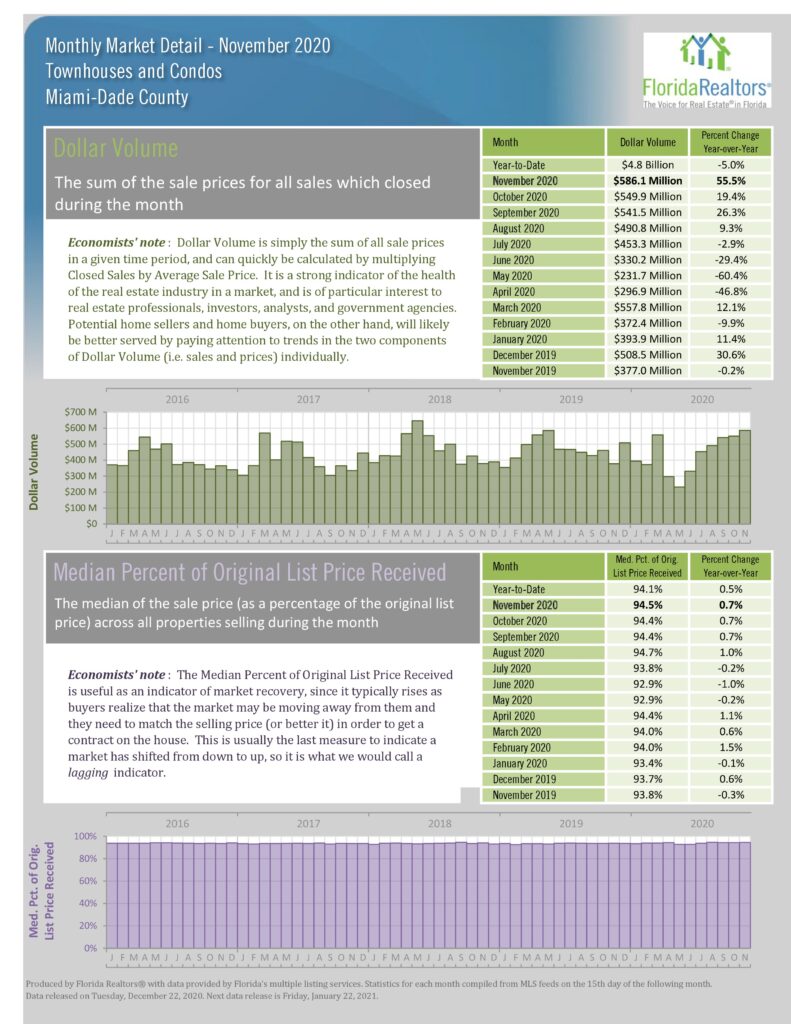
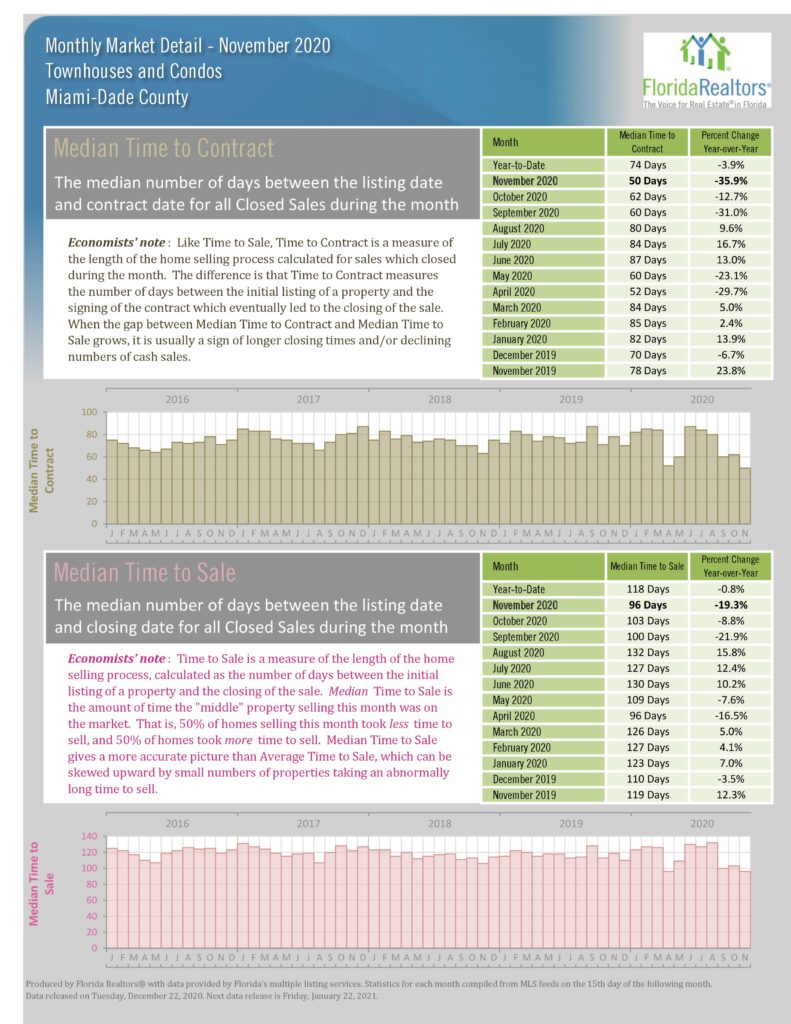
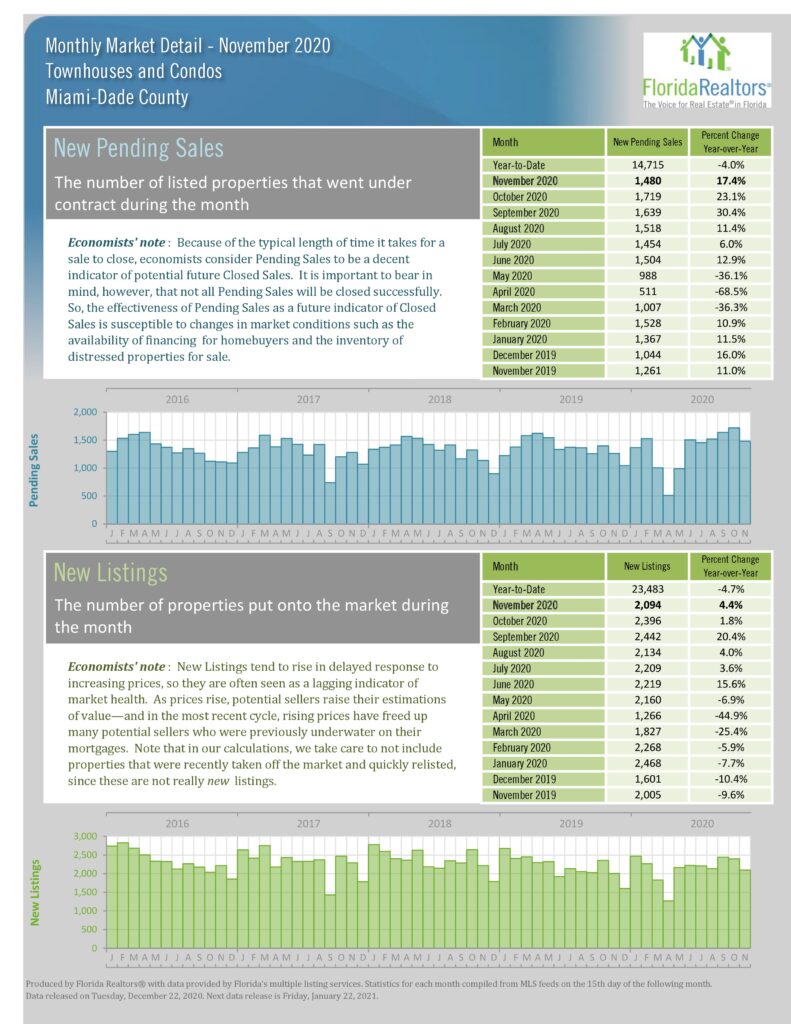
The condo market is coming back strong compared to November last year with 23% more closings, median price up over 10% and dollar volume jumped by 55.5%, plus pending sales are up 26.3%. County wide there is a 13 month supply of inventory but on the beaches its 20 months due to less travelers coming in to buy second homes but … there is the pent up demand we will be experiencing, hopefully soon. Single Family is still going strong and gaining speed. Dollar volume up 77.1%, closed sales up 18.7% and median prices jumping 23.3% as inventory is down over 40% with a 3.6 month supply. These factors have some potential home buyers thinking about condos.
Stay safe and be well.

We’re here to serve you.
Statistics about traditional, foreclosure/REO, and short sales. One is done over closed sales percentages. The other is done over median sale price. Statistics chart for new listing by initial listing price and inventory by current listing price. Statistics chart for closed sales by sale price and median time to contract by sale price. Statistics chart for inventory (active listings) and month’s supply of inventory. Both have year-to-date (monthly average) and monthly statistics. Statistics chart for new pending sales and new listings. Both have year-to-date and monthly statistics. Statistics chart for median time to contract and median time to sale. Both have year-to-date and monthly statistics. Statistics chart for dollar volume price and median percent of original list price. Both have year-to-date and monthly statistics. Statistics chart for median sale price and average sale price. Both have year-to-date and monthly statistics. Statistics chart for cash sales and cash sales as a percentage of closed sales. Both have year-to-date and monthly statistics. Summary statistics for all September statistics. Close sales statistics chart, with monthly changes and year-to-date numbers.

Share:

Copyright ©. No guarantee, warranty or representation of any kind is made regarding the completeness or accuracy of descriptions or measurements including but not limited to square footage, room count, number of bedrooms, or designated school, and should be independently verified and expressly disclaim any liability in connection therewith. While, information from this website including market statistic data is believed to be correct, it is represented subject to errors, omissions, changes or withdrawal without notice. All material presented herein is intended for information purposes only. No financial or legal advice provided. Equal Housing Opportunity.