Miami Real Estate Report, November 2021 Statistics

KEY NUMBERS (Compared to November 2020)

  • Number of Condo Sales Up 42% YTD 88.3%
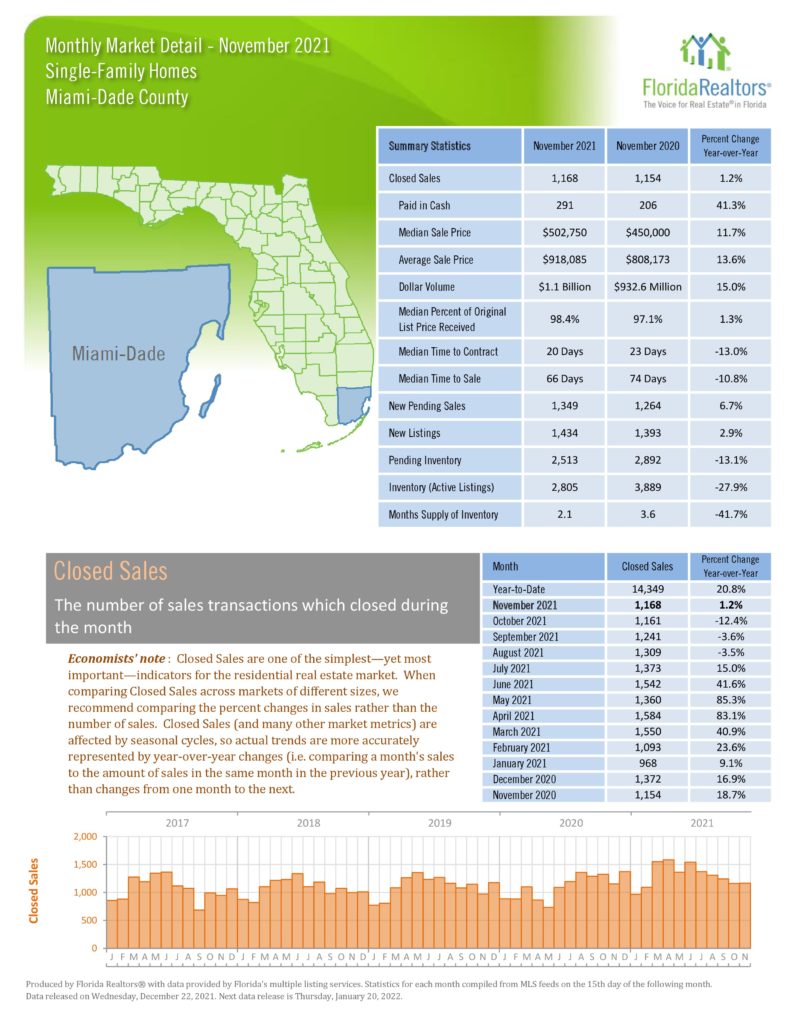
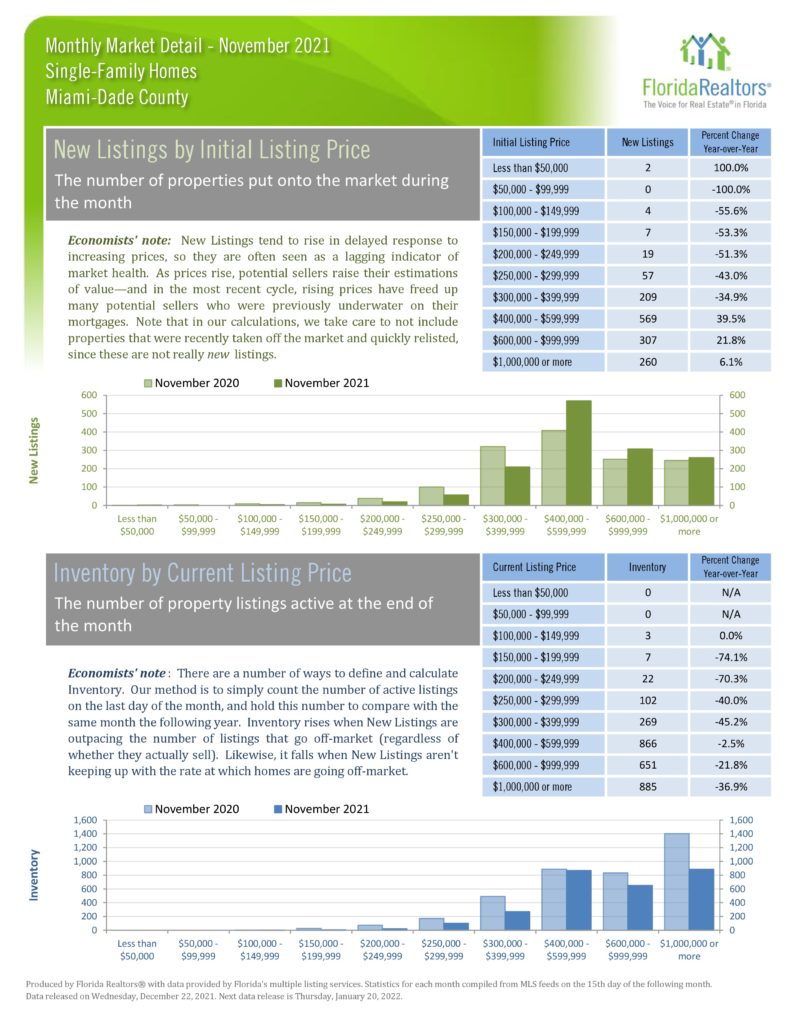
  • Number of Single Family Sales Up 1.2% YTD Up 20.8%
  • Median Condo Price – Up 28.1% YTD 23.8%
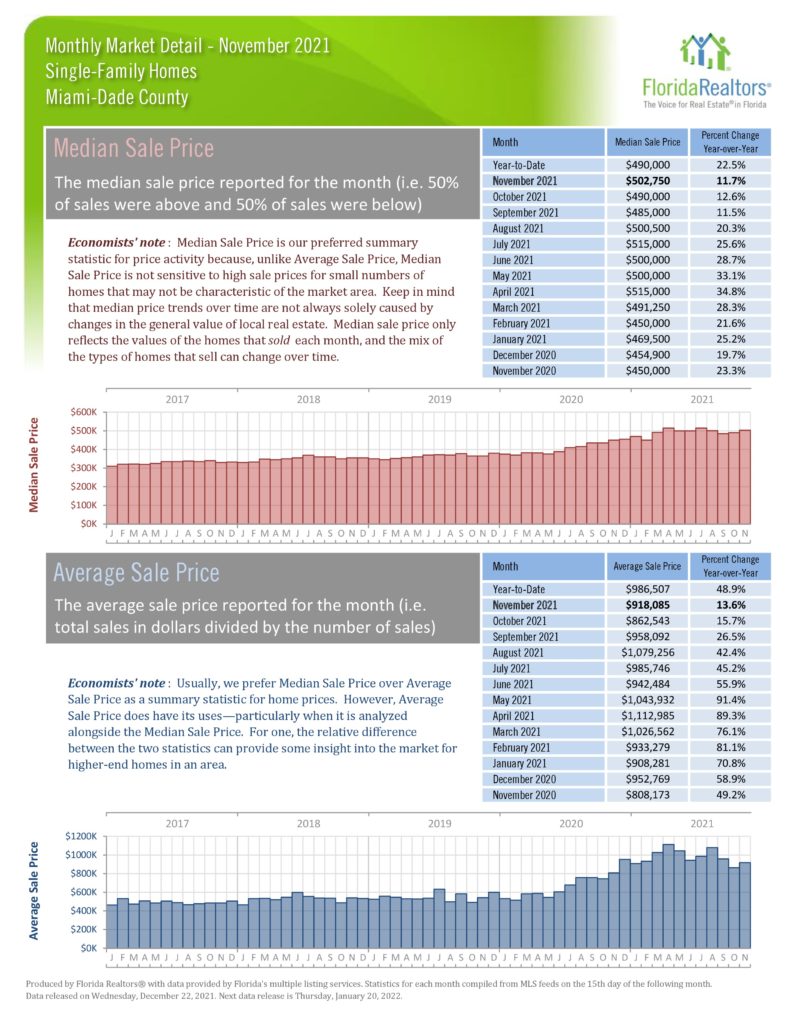
  • Median Single Family Price Up 11.7%
  • Closed Dollar Volume
    • Condos $1.1Bill. Up 92.8%
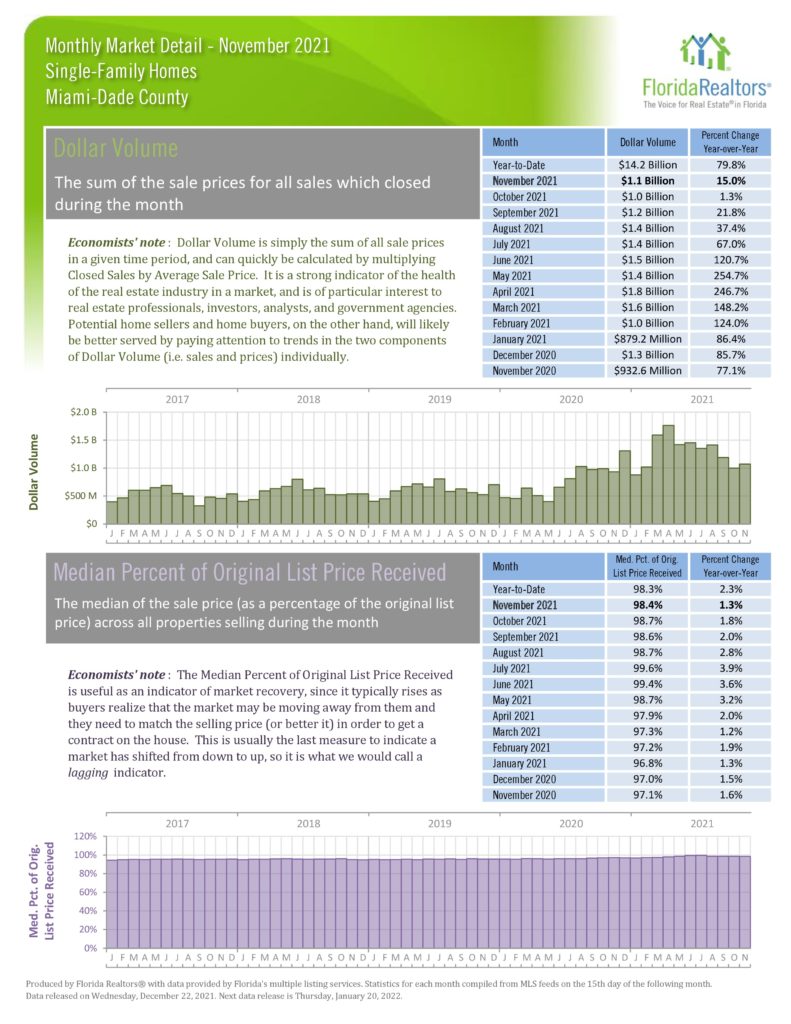
    • SFH $1.1Billion Up 15%

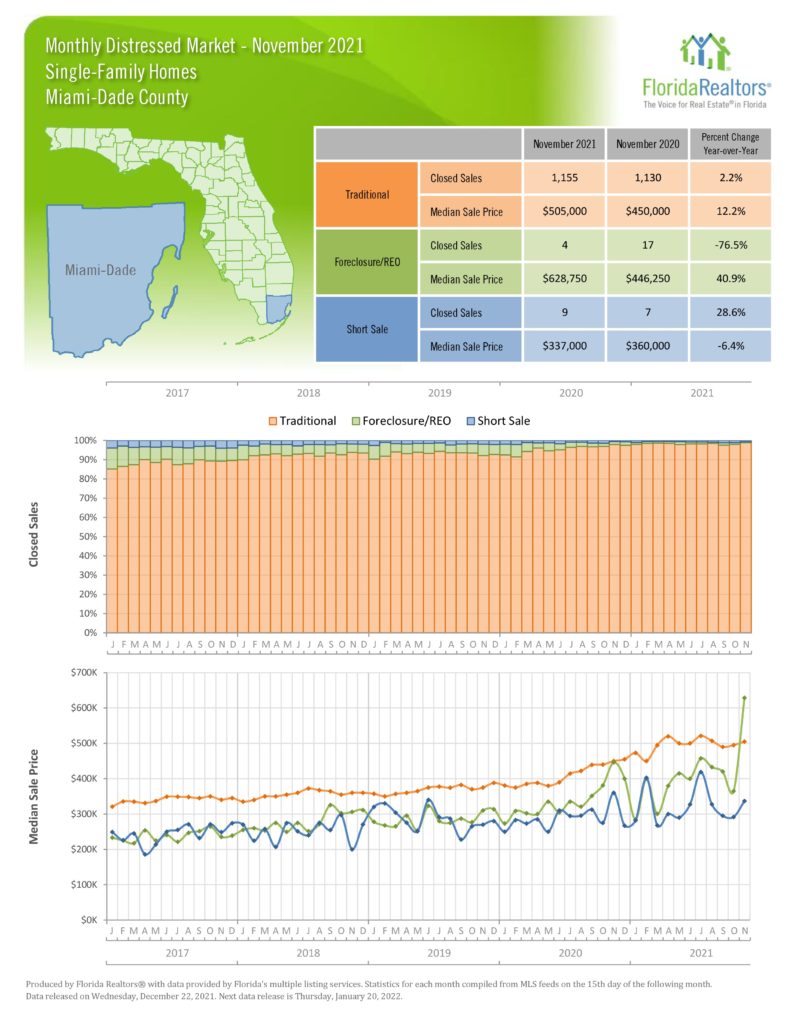
Miami Real Estate has been the focus of many transplants relocating here for quality of life and economic factors, with many from the Tech and Finance industries willing to pay in the higher price ranges. The single family inventory was depleted first and then interest turned to condos. SFH numbers continue to be positive – except for inventory – while condos numbers are exploding. November condo sale were up 42% from last year and 88.3% YTD. Since November 2019 – pre-pandemic – condo sales dollar volume is up 192%. Condo and Single Family median prices were up 28.1% and 11.7% respectively. The general consensus of the Industry Insiders is that this market is being built on real buyers, with money, moving here. They anticipate the movement to continue and prices will continue to increase with the pace diminishing in time.

Statistics about traditional, foreclosure/REO, and short sales. One is done over closed sales percentages. The other is done over median sale price. Statistics chart for new listing by initial listing price and inventory by current listing price. Statistics chart for closed sales by sale price and median time to contract by sale price. Statistics chart for inventory (active listings) and month’s supply of inventory. Both have year-to-date (monthly average) and monthly statistics. Statistics chart for new pending sales and new listings. Both have year-to-date and monthly statistics. Statistics chart for median time to contract and median time to sale. Both have year-to-date and monthly statistics. Statistics chart for dollar volume price and median percent of original list price. Both have year-to-date and monthly statistics. Statistics chart for median sale price and average sale price. Both have year-to-date and monthly statistics. Statistics chart for cash sales and cash sales as a percentage of closed sales. Both have year-to-date and monthly statistics. Summary statistics for all September statistics. Close sales statistics chart, with monthly changes and year-to-date numbers.

Share:

Copyright ©. No guarantee, warranty or representation of any kind is made regarding the completeness or accuracy of descriptions or measurements including but not limited to square footage, room count, number of bedrooms, or designated school, and should be independently verified and expressly disclaim any liability in connection therewith. While, information from this website including market statistic data is believed to be correct, it is represented subject to errors, omissions, changes or withdrawal without notice. All material presented herein is intended for information purposes only. No financial or legal advice provided. Equal Housing Opportunity.