Miami Real Estate Report, October 2020 Statistics
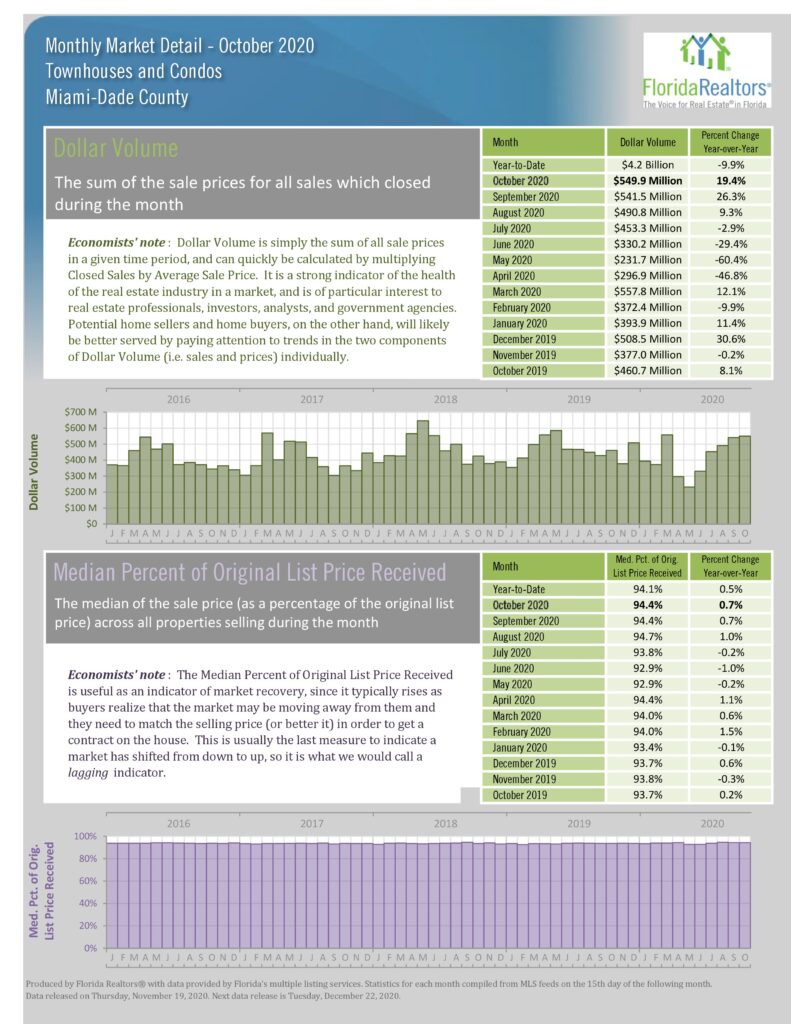
There’s big money chasing Single Family Homes! The average sale price is up 52% and total dollar volume up 75.5%! With inventory down 40% causing major price increases, we’re anticipating more buyers to consider buying a condo. The condo market continues to improve with closed sale up almost 17%, volume up 19.4%, pending sales up 31% and inventory down 8.4%. The beach market is softer than the mainland where domestic buyers are buying primary residences, but the beach market has many outstanding opportunities and the superior quality of life and outdoor living is drawing renewed interest and with air travel opening up international buyers will be back. Stay safe and be well.
We’re here to serve you.
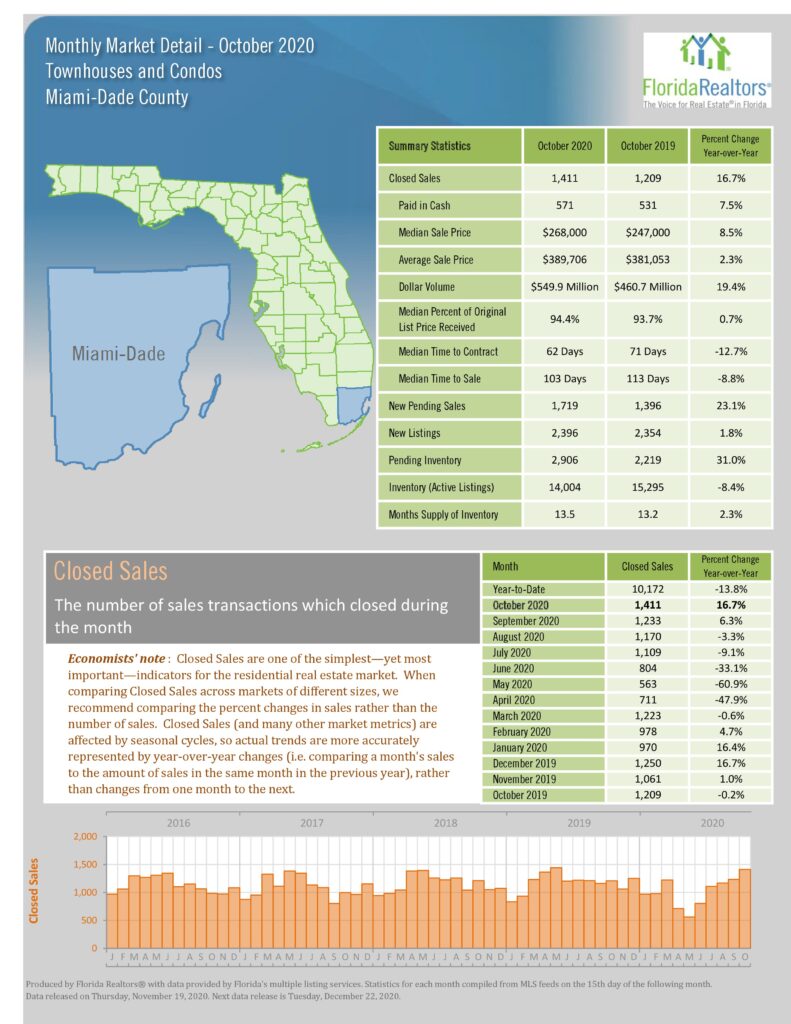
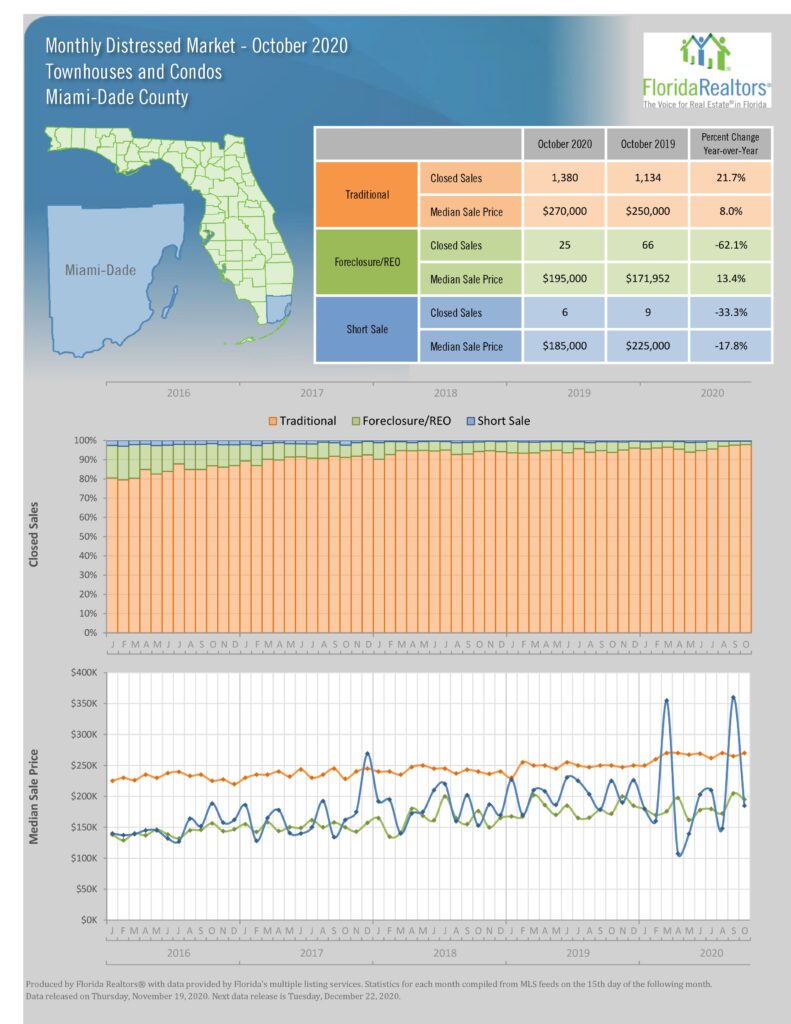
KEY NUMBERS (Compared to October 2019)
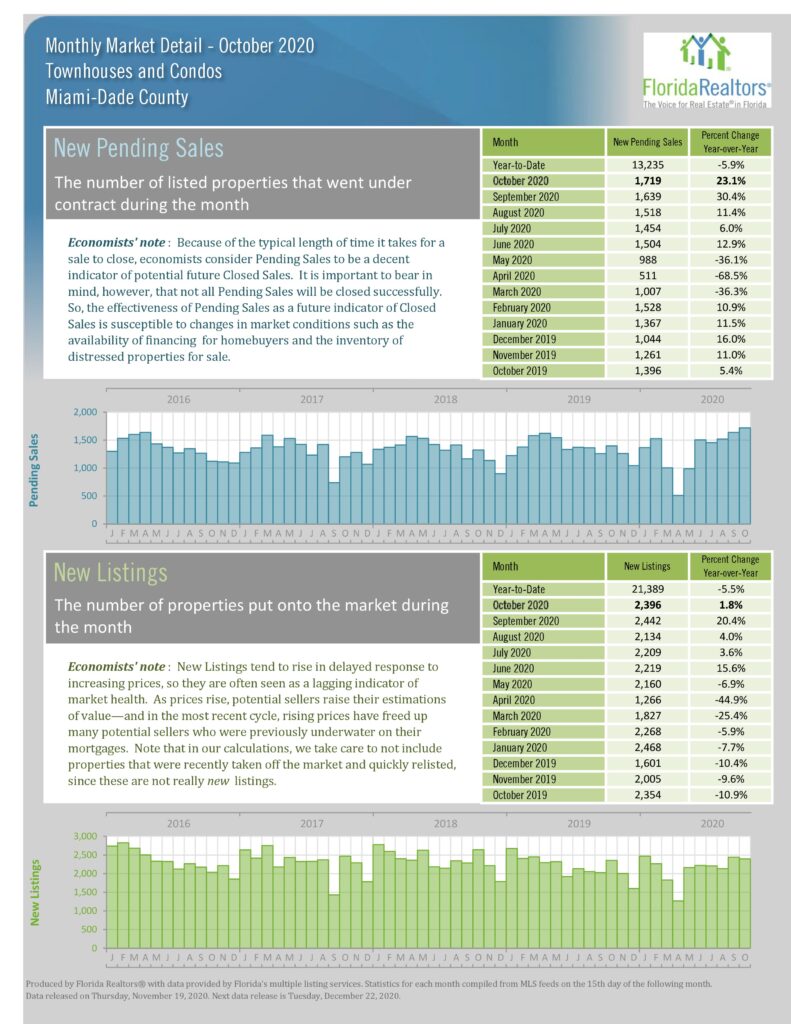
- Number of Condo Sales Up 16.7%
- Number of Single Family Sales Up 15.7%
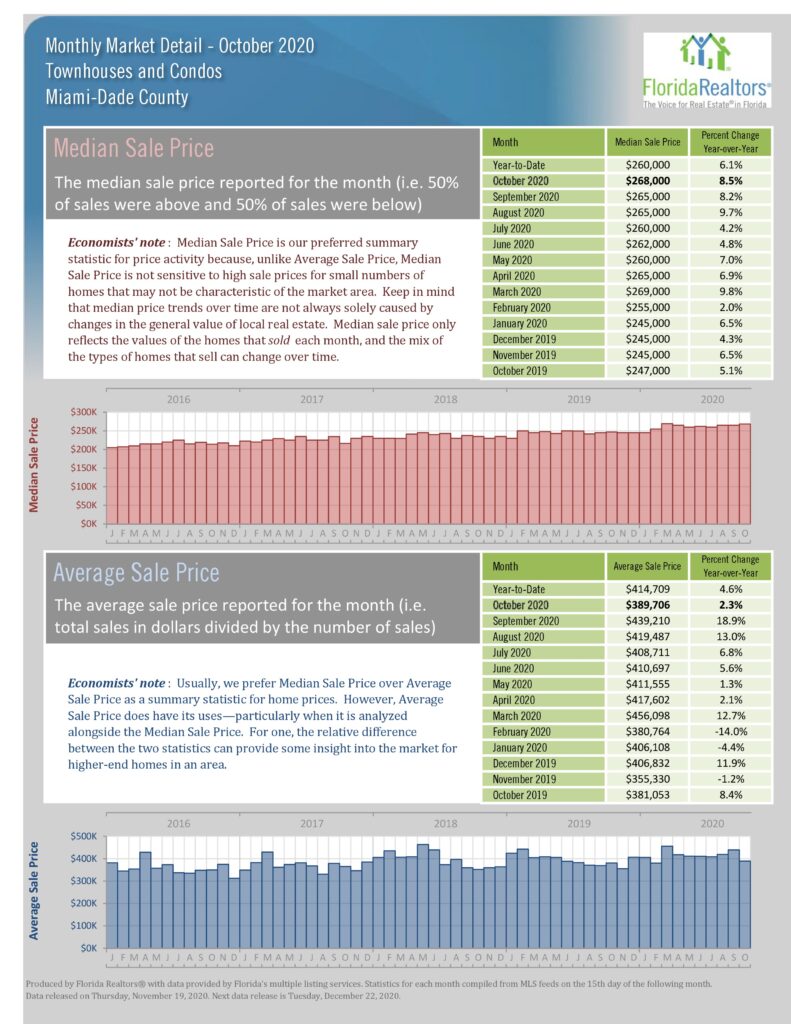
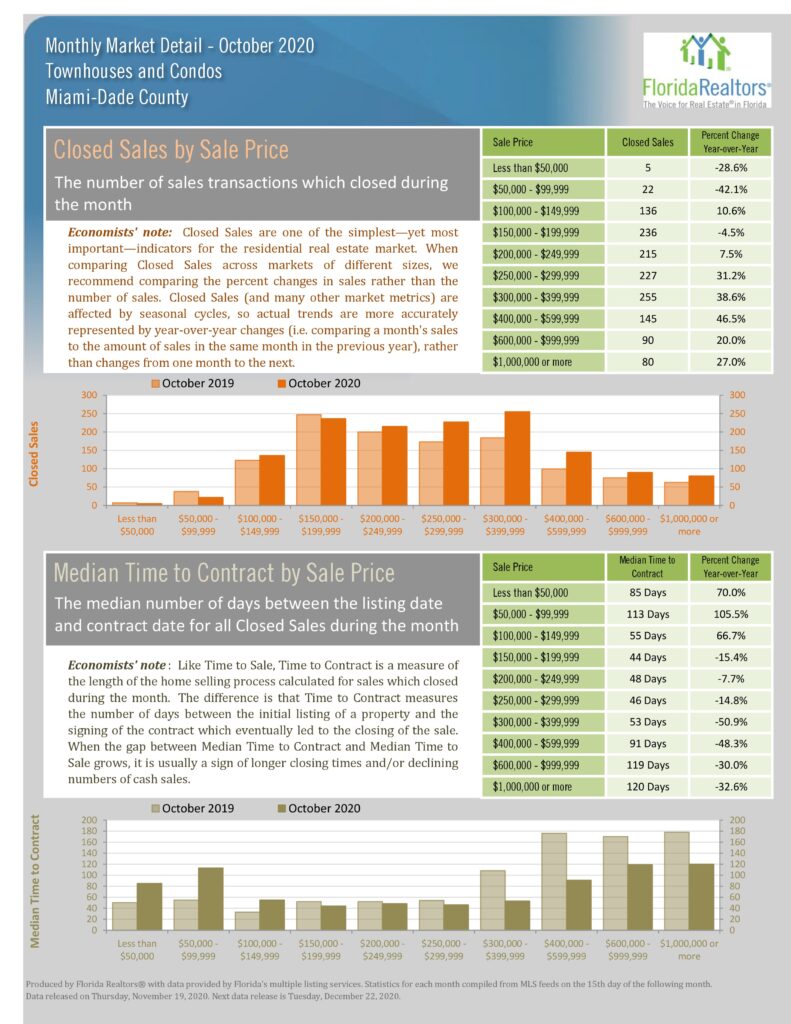
- Median Condo Price – Up 8.5%
- Median Single Family Price Up 19.2%
- Inventory (# of listings)
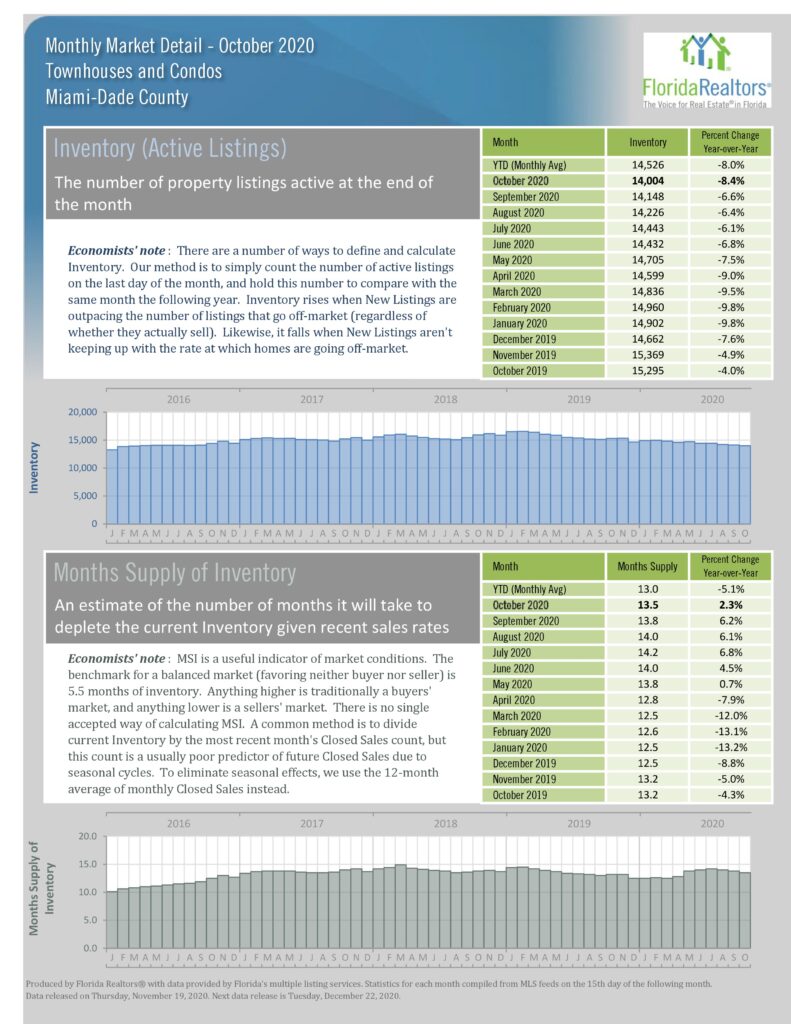
- Condos Down 8.4%
- SFH Down 39.8%
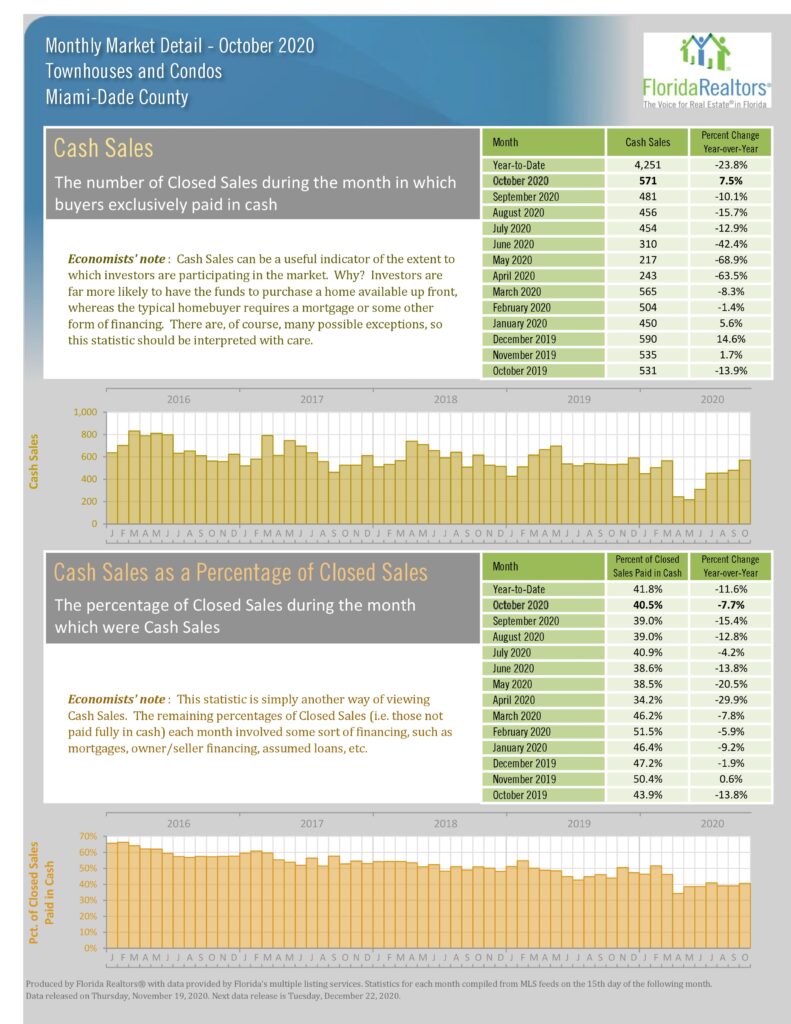
Statistics chart for cash sales and cash sales as a percentage