Miami Real Estate Report, August 2023 Statistics
KEY NUMBERS (Compared to August 2022)
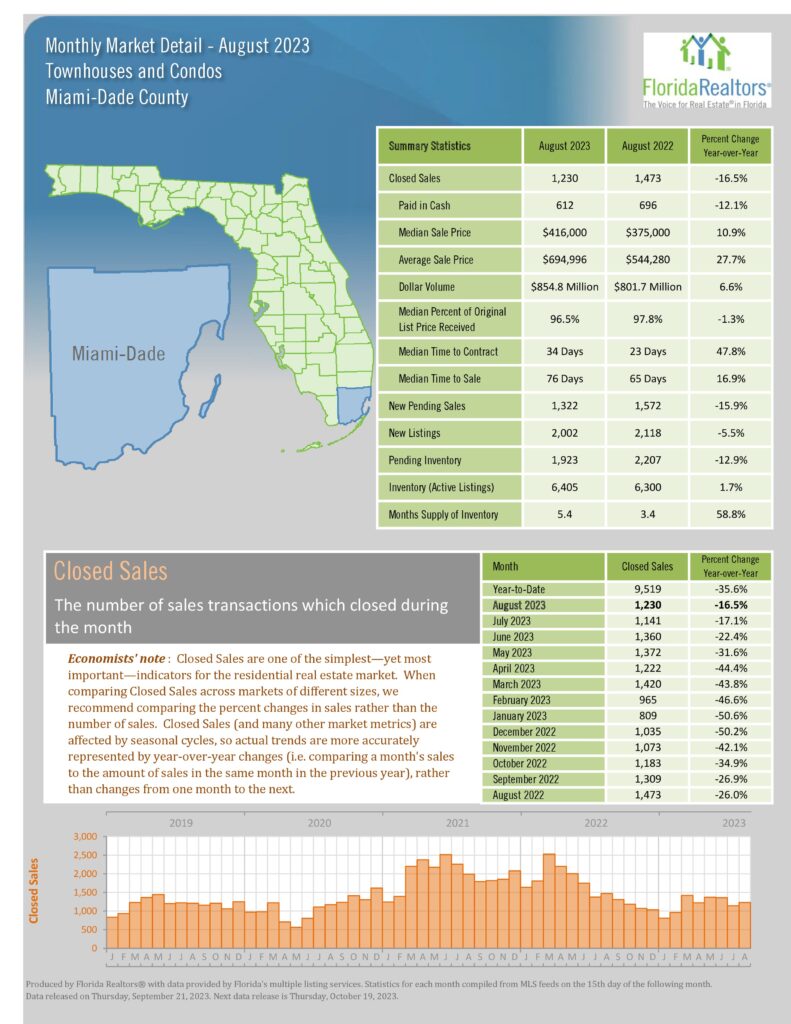
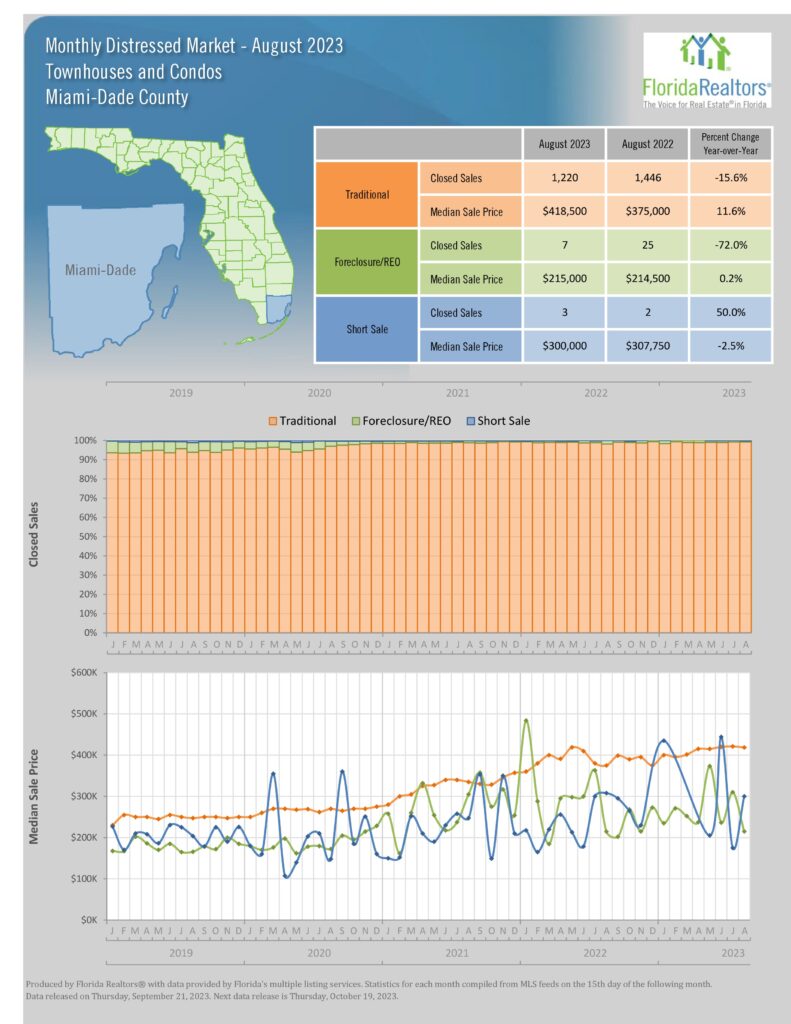
- Number of Condo Sales
- Down 16.5%
- Number of Single Family Sales
- Down 8.1%
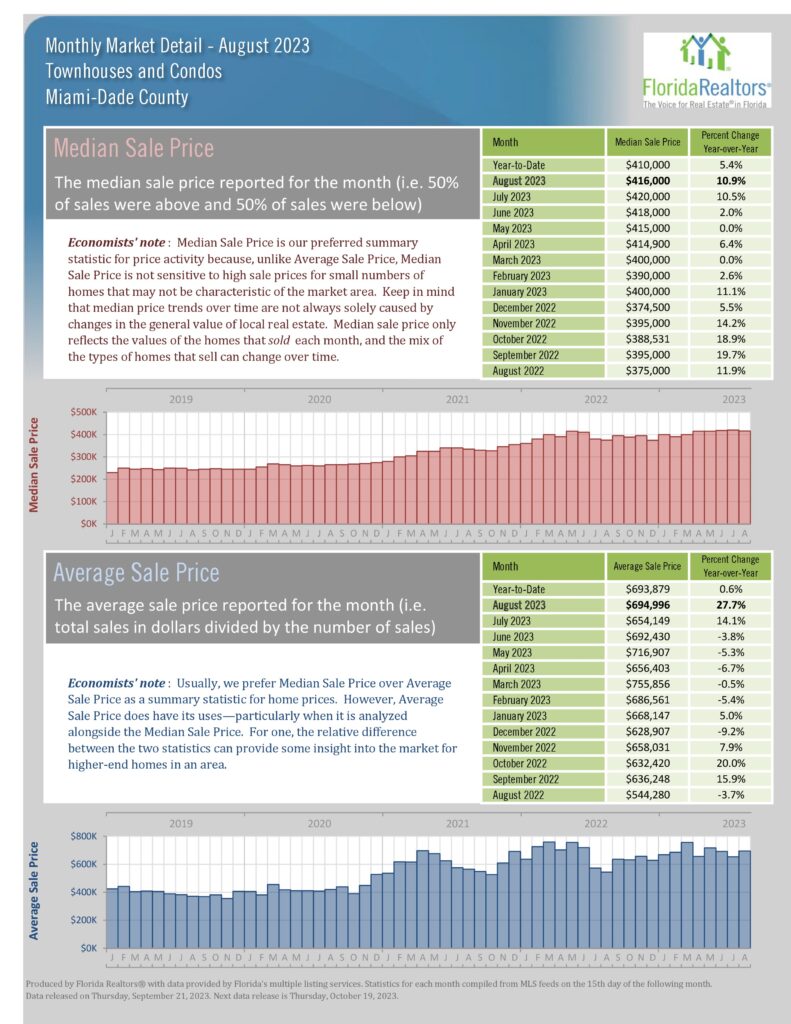
- Median Condo Price –
- Up 10.9% & 5.4% YTD
- Median SFH Price Up12.5% & 9.1% YTD
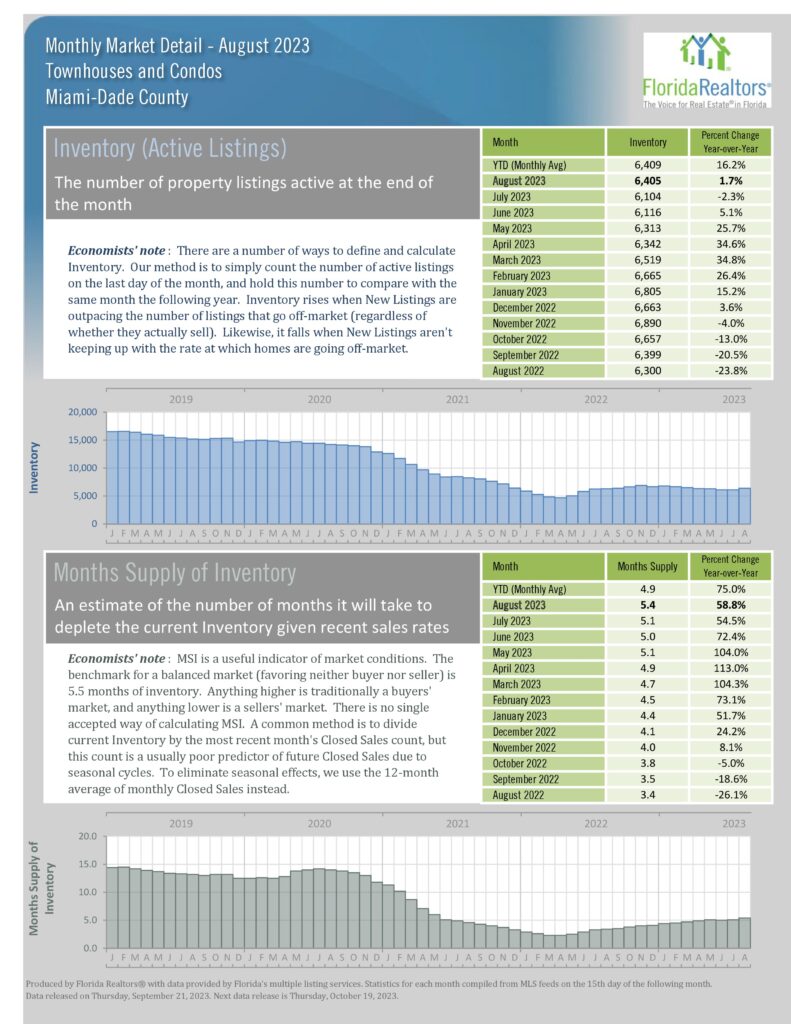
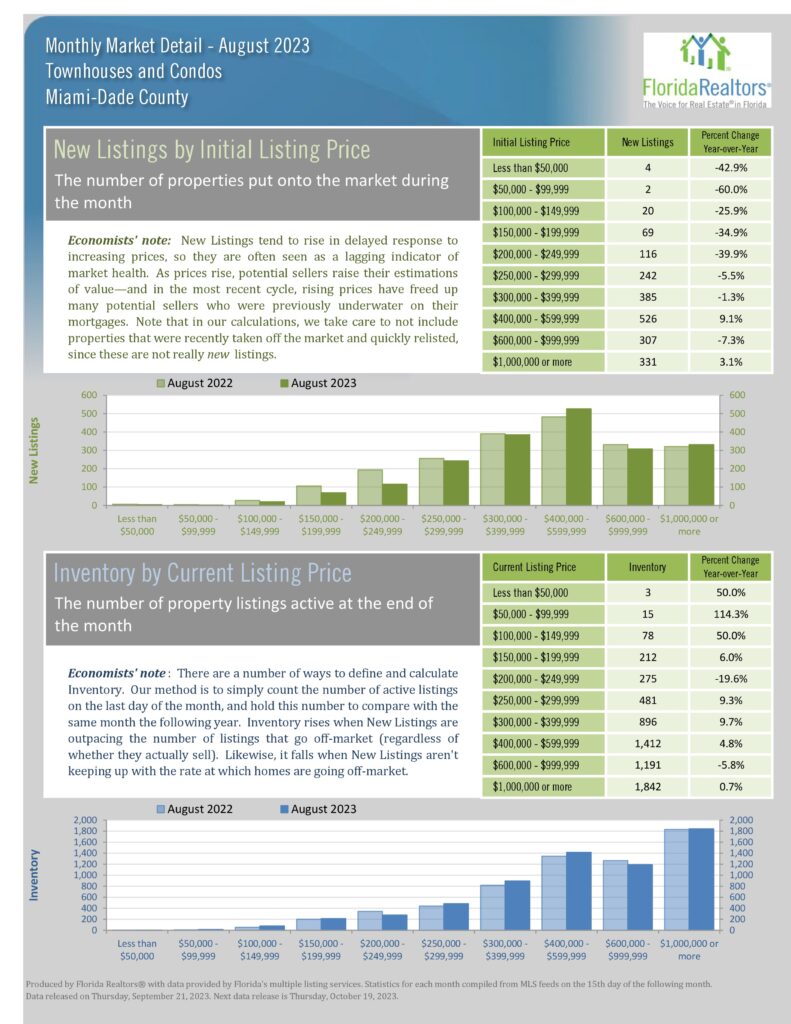
- Inventory
- Condos Down 1.7%
- SFH Down 19.7%
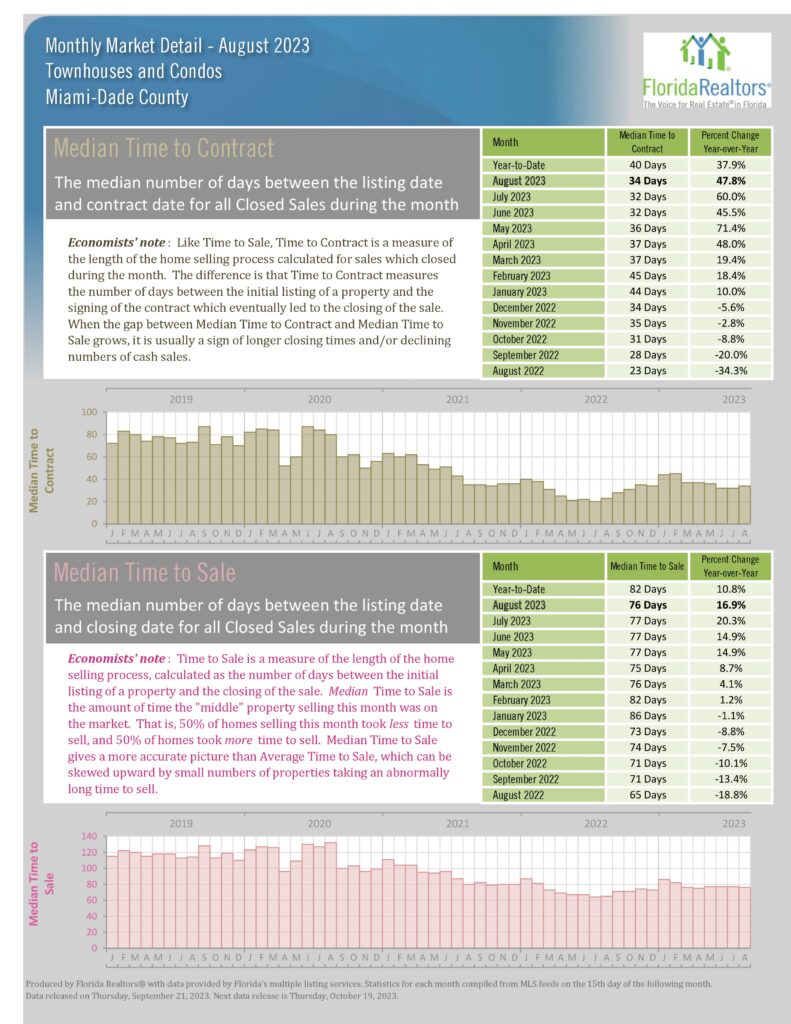
- Days On Market
- Condos 34 Days
- SFH 23 Days
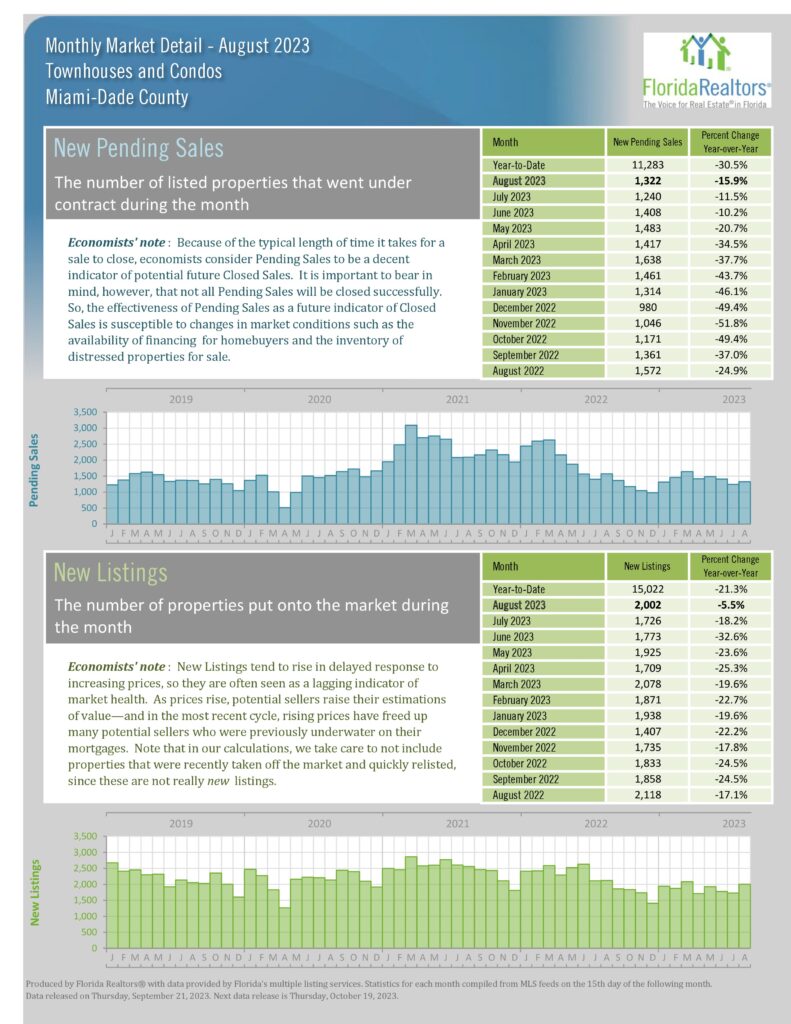
- Pending Inventory
- Condos Down 12.9%
- SFH Down 7.6%
Months Supply
- Condos 5.4 months
- SFH 3.5 months
Closed sales for both condos and single family are still down, 16.5% and 8.1% respectively compared to last August.
Condo inventory was up 1.7% from a year ago but it is up 27.5% from the month of the first peak median price of $415k in May 2022. Since then, there were very minor decreases in the median prices until May 2023 when it hit $415k again, then $418k in June, $420k in July and now $416k in August. A more stable median price movement was needed as the May 2022 median price was a staggering 27.7% higher than May 2021.
Single-family median price was up 12.5% from last August and 9.1% year to date.
There is a 5.4-month supply of condo inventory and 3.5 for single family. Meaning, if no new listings came on the market, it would take that many months to sell them out. A balanced market is believed to be between 6 and 9 months of inventory. We are still in the Seller’s Market territory.
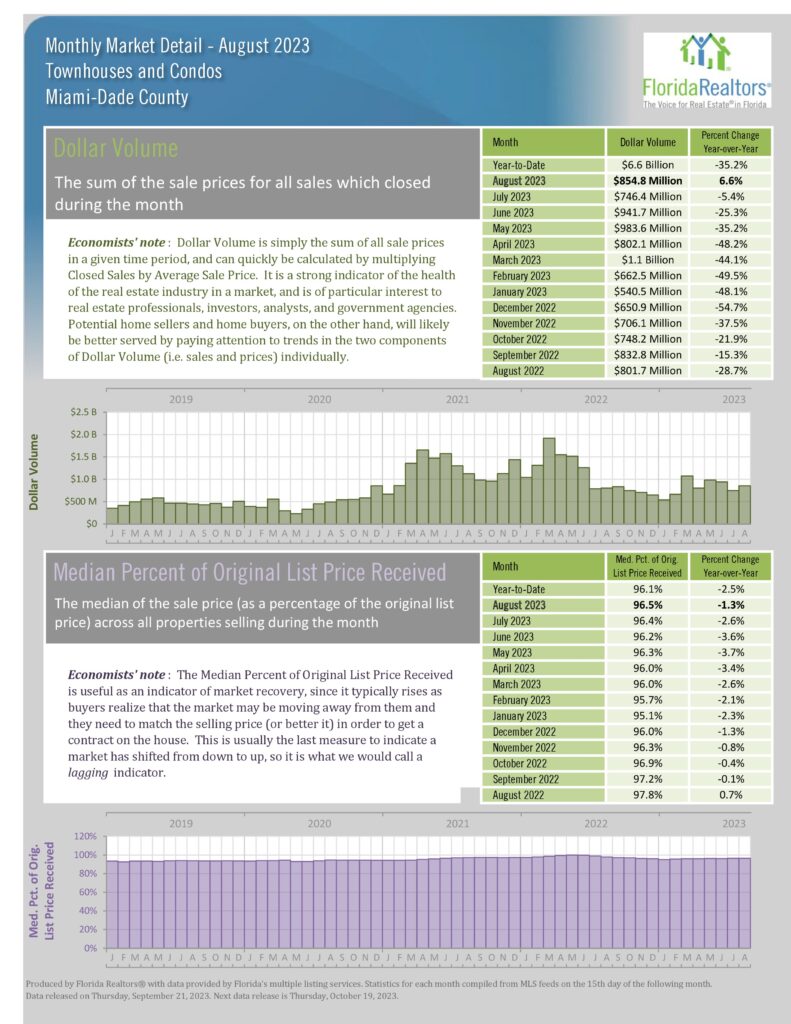
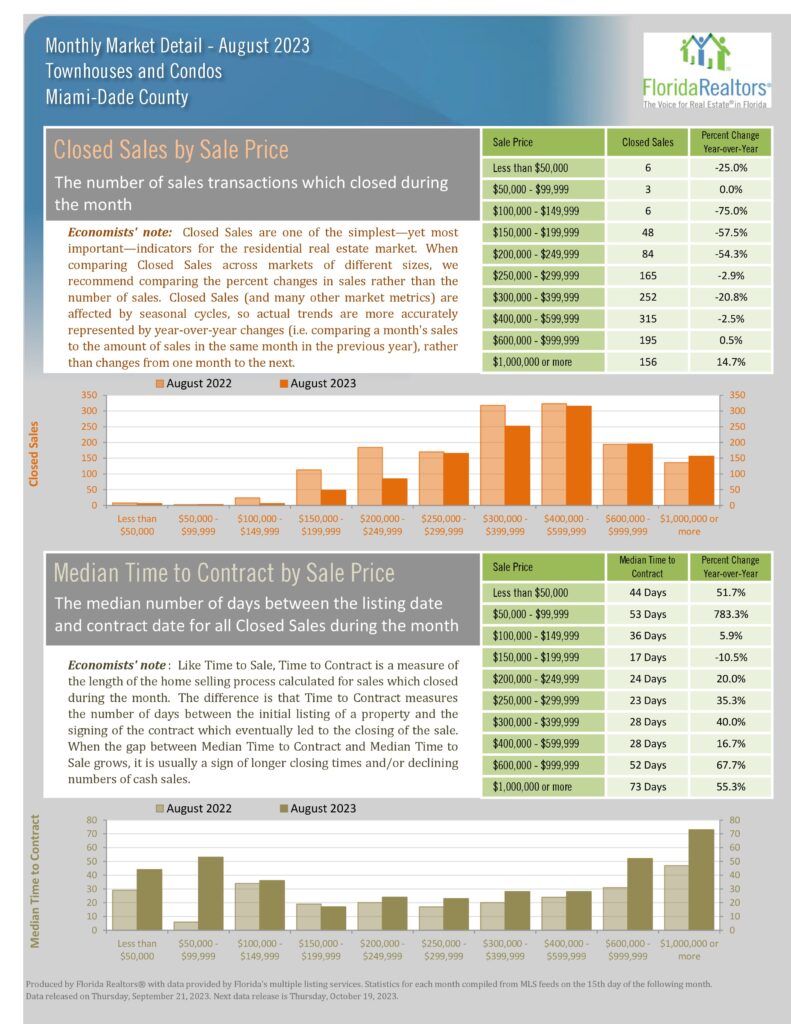
The total Dollar Volume of single-family homes was flat at $1 billion while condo volume increased 6.6% mainly due to a 14.7% increase in sales over $1million.
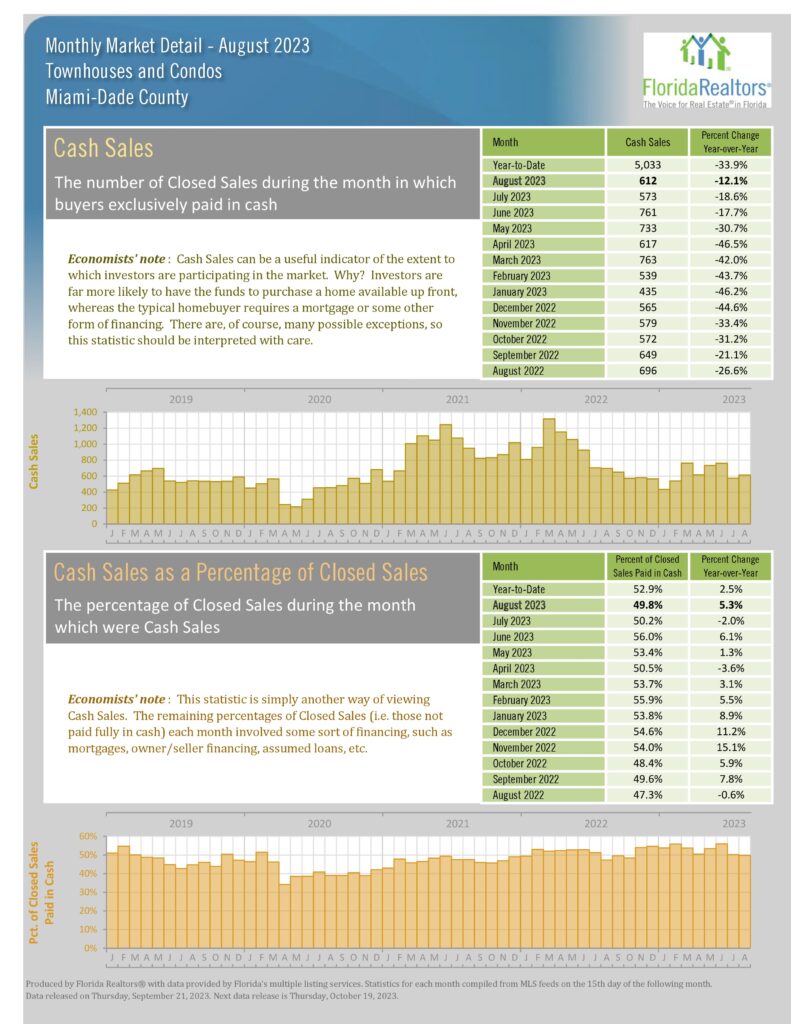
The Miami market has the advantage of a much higher percentage of cash buyers than the national average with 28% of single-family and 49.8% of condo sales being cash.
The consensus of Industry leaders is that we will not see a decline in values, but more inventory is needed and lower interest rates on the not-too-distant horizon will have a noticeable impact.
If you’ve considered selling, please contact us.