Miami Real Estate Report, February 2024 Statistics
KEY NUMBERS (Compared to February 2023)
- Number of Condo Sales
- Down 2.5%
- Number of Single Family Sales
- Up 5.1%
- Median Condo Price –
- Up 7.7%
- Median SFH Price
- Up 17.1%
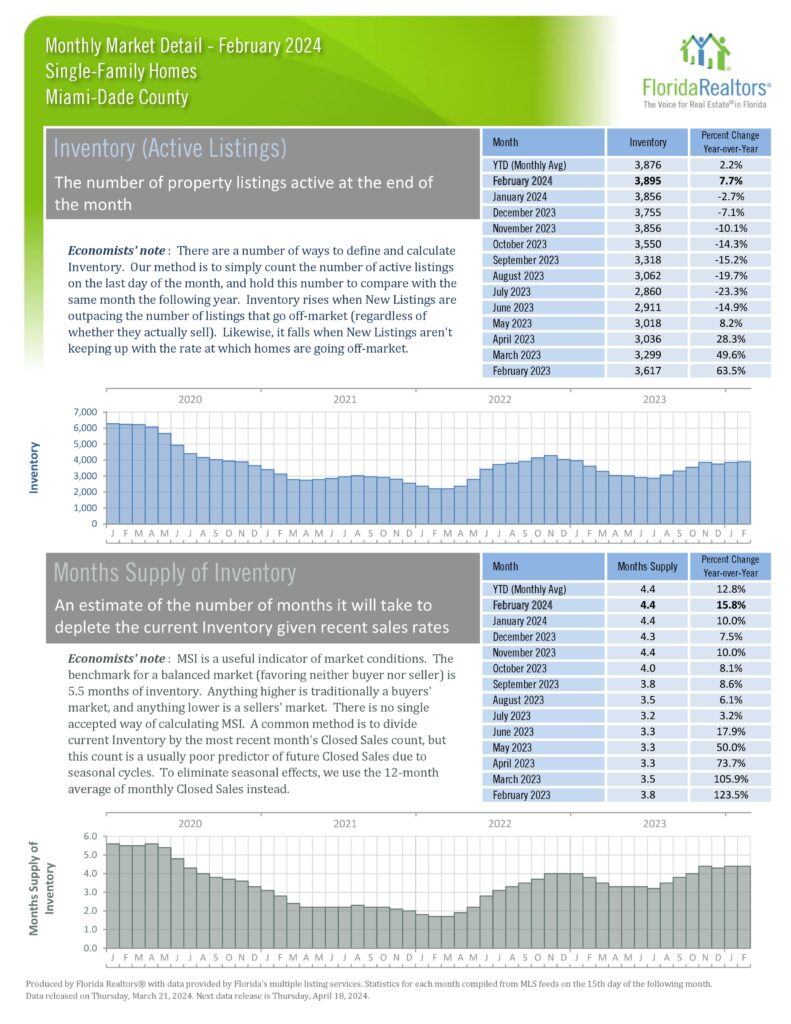
- Inventory
- Condos Up 32.4%
- SFH Up 7.7%
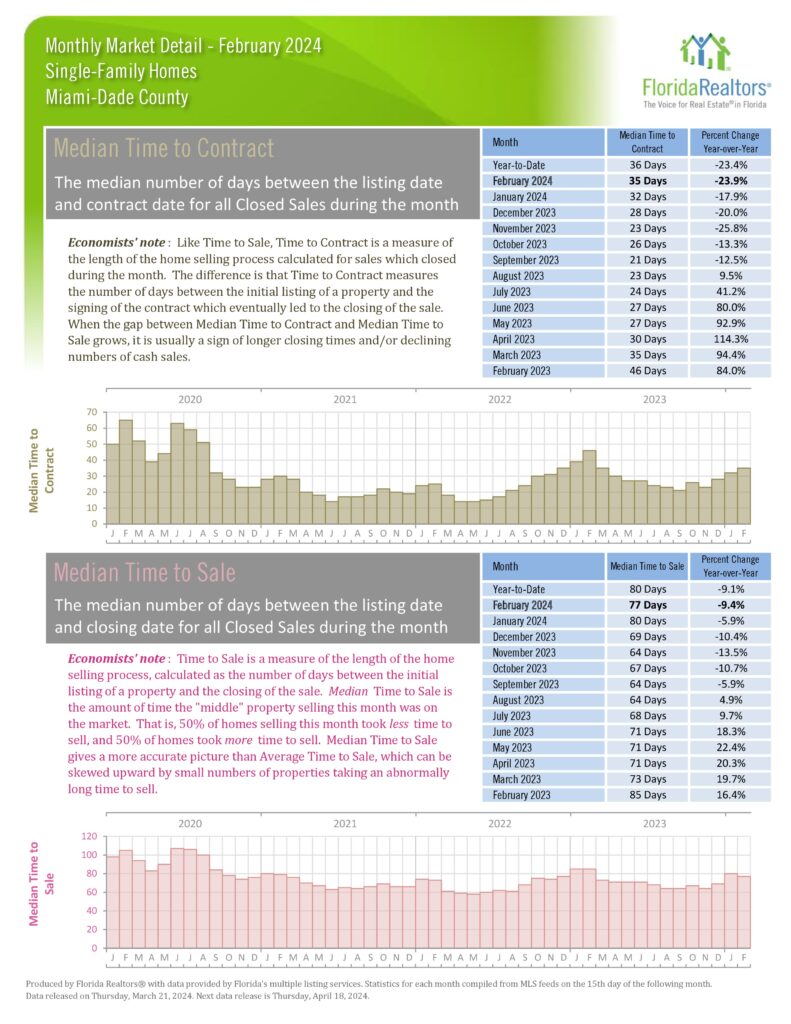
- Days On Market
- Condos 49 Days
- SFH 35 Days
- Pending Inventory
- Condos Down 16.2%
- SFH Down 4.8%
- Months Supply
- Condos 7.8 months
- SFH 4.4 months
A point of clarification. Today, March 21, 2024, is the day that all official real estate market statistics, for February, are released Nationally, Statewide and Locally. These are the numbers that all media work from. The March numbers will be out on April 18.
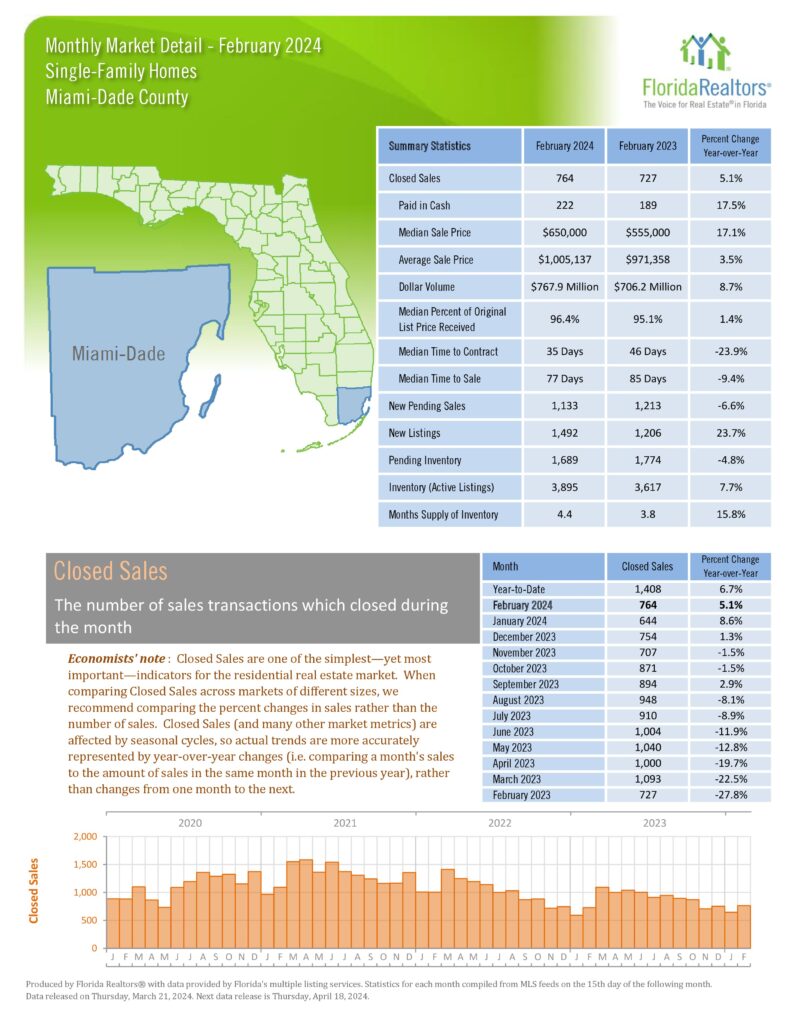
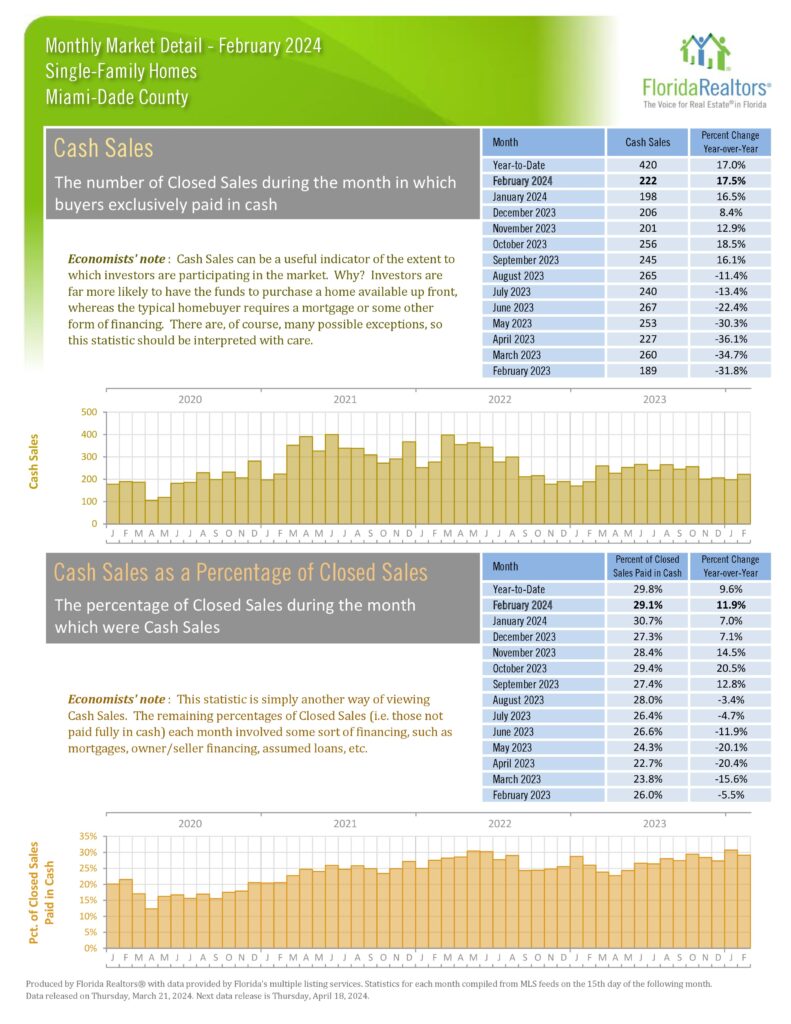
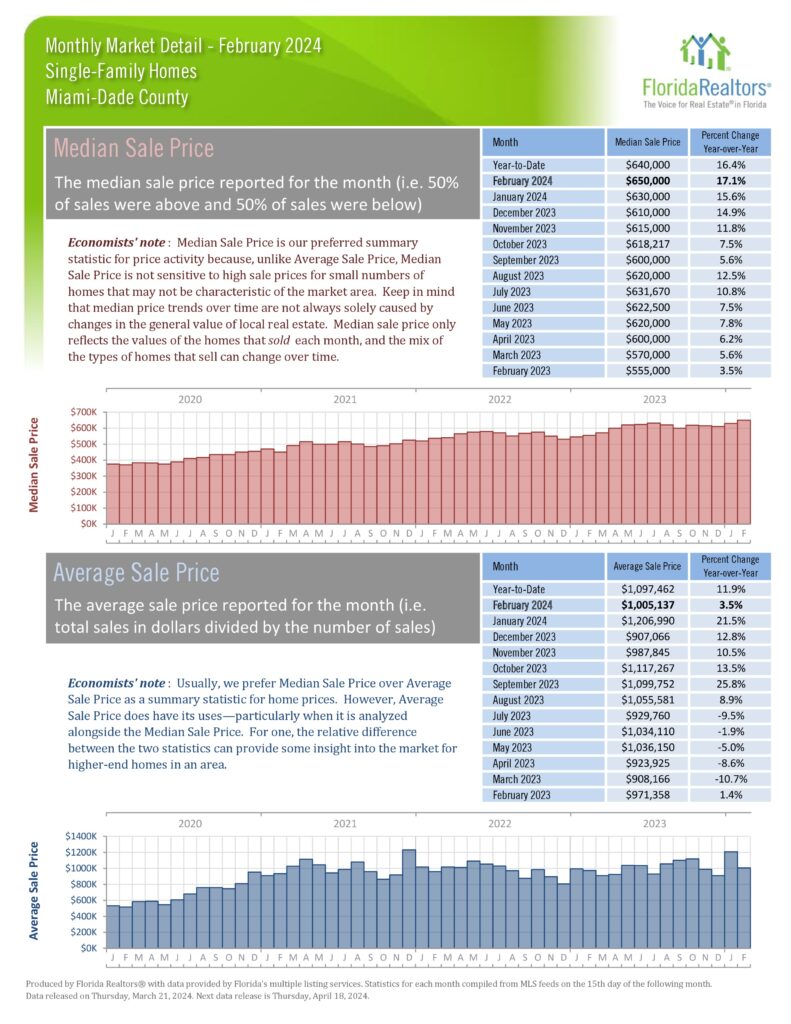
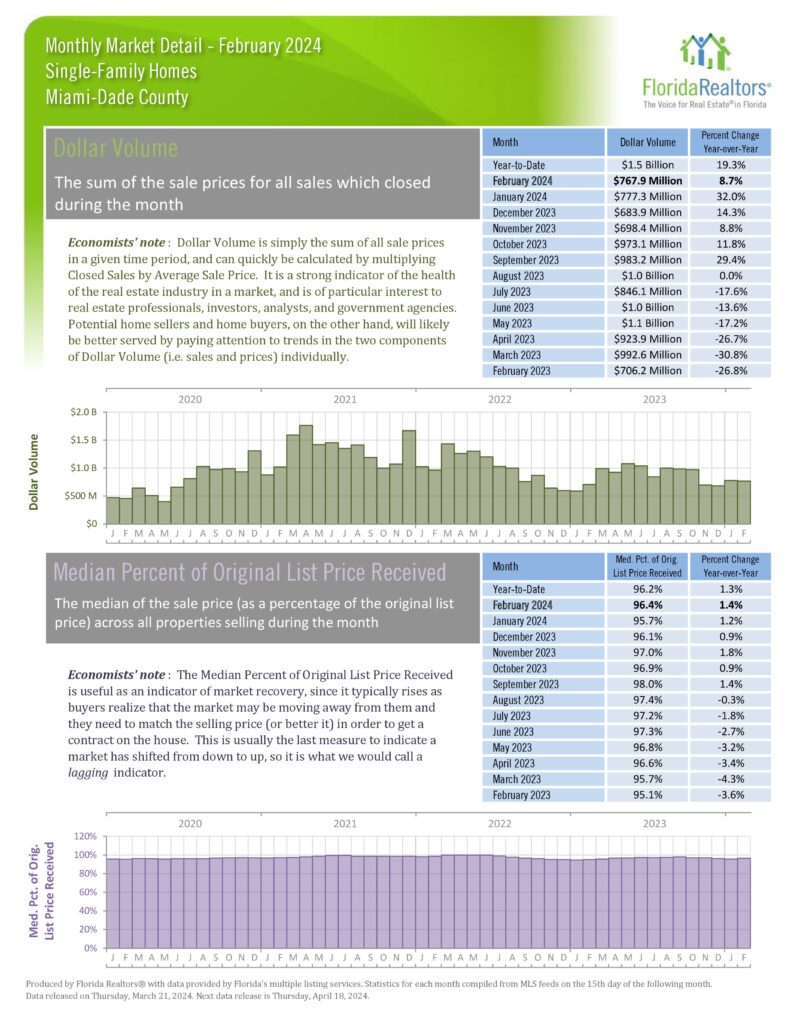
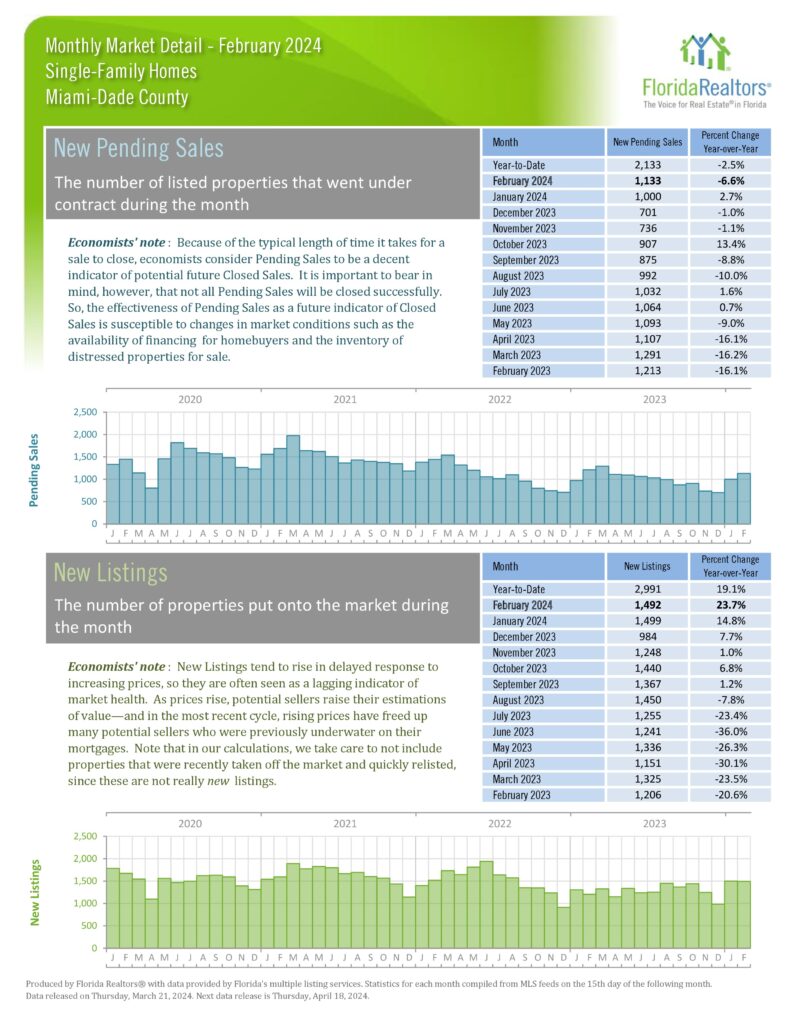
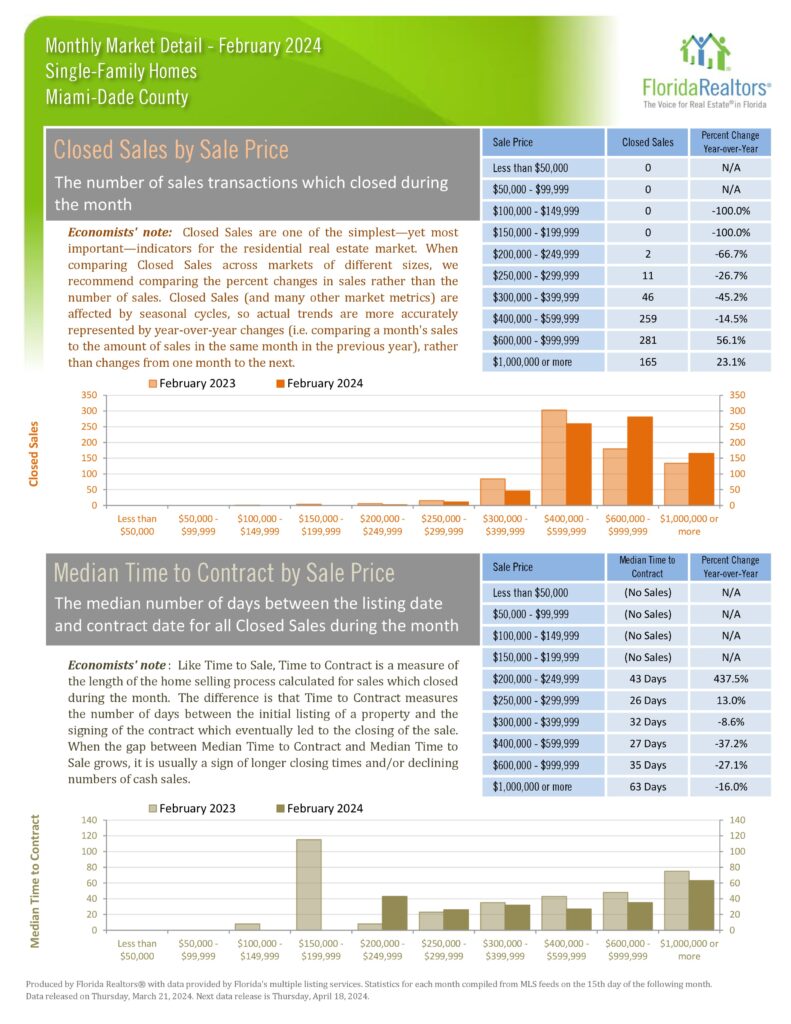
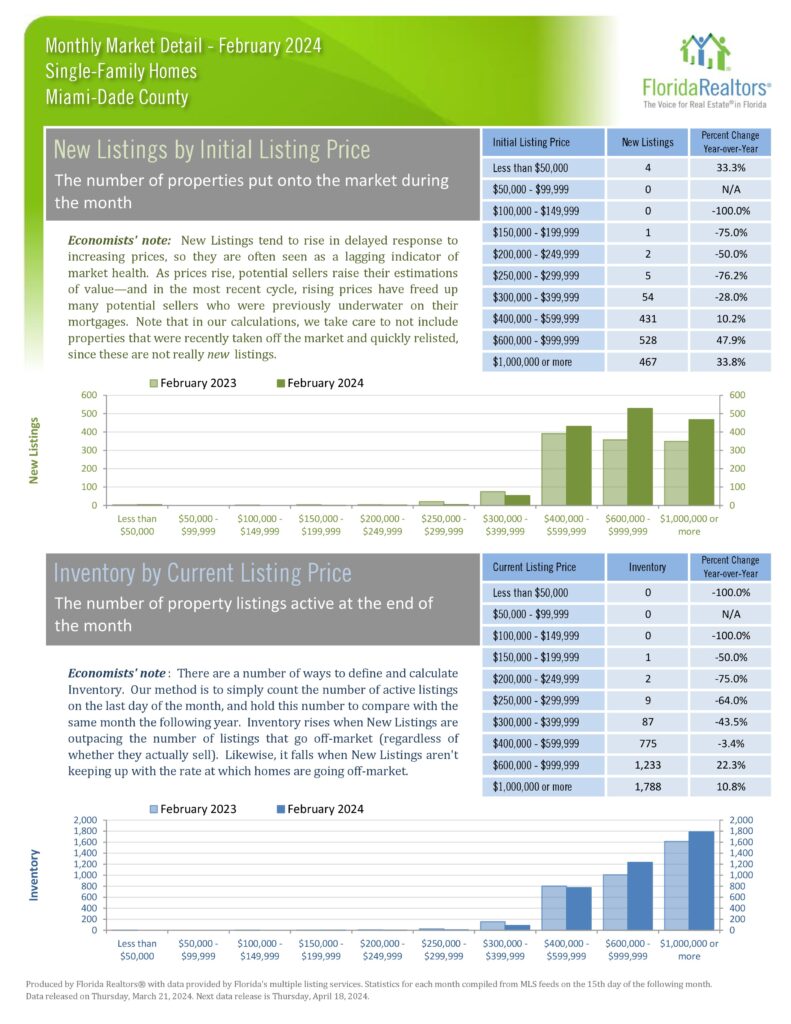
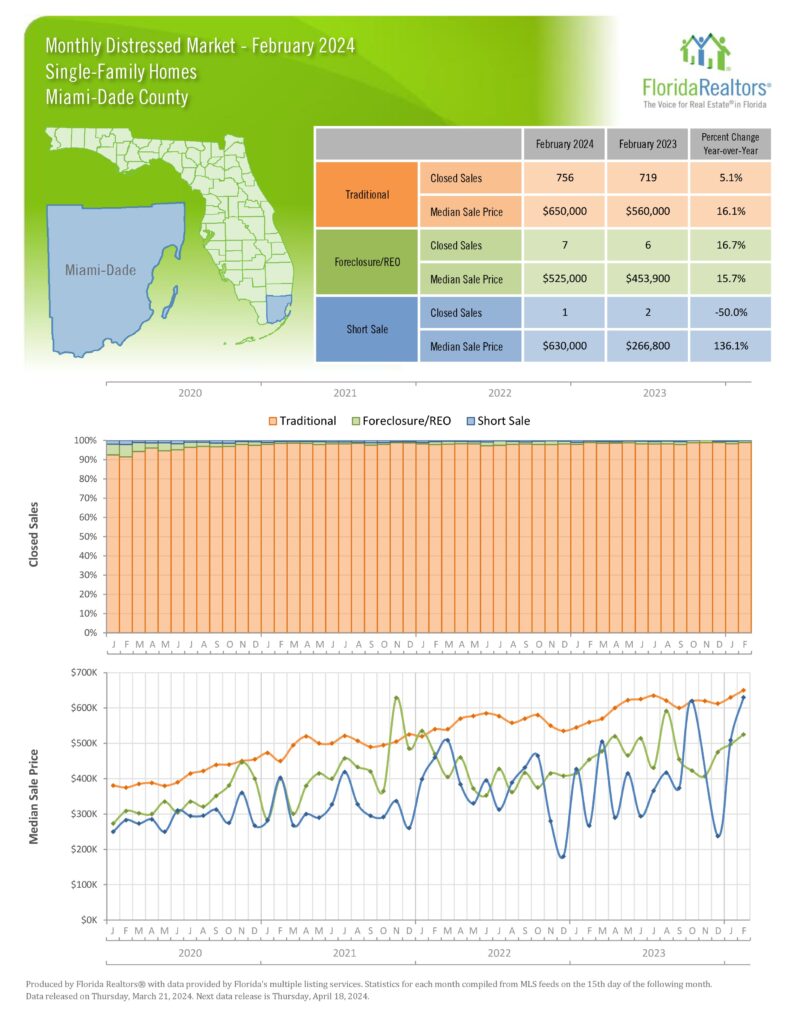
Closed Condo sales in February were down just 2.5% from February 2023 and only 3.8% less than February 2020 – pre-pandemic when interest rates were much lower. Because of the high rates now, 54.9% of sales were cash. Many buyers needing financing are still on the sidelines. Single family home closed sales were up 5.1% with sales in the $1mil+ range up 23.1% and the $600k-$1mil. range up a whopping 56.1%. New pending sales for both condos and single family saw a drop starting in 3Q23, but both are experiencing increases in the first 2 months of this year. Median Condo price at $420k was up 7.7% and during the last 12 months, the average Median Price was $413,304 indicating a controlled but steady increase. Single family Median Price was up 17.1%, and all time high. A balanced market is recognized as having a 6-to-9-month supply of inventory. We are at a 4.4-month supply for Single Family and 7.8 months for condos. Distressed sales represented just 1% of all sales. This is not a distressed market.
Solid values, strong cash sales, increased inventory and lower interest rates on the horizon – all good indicators.