Miami Real Estate Report, August 2021 Statistics

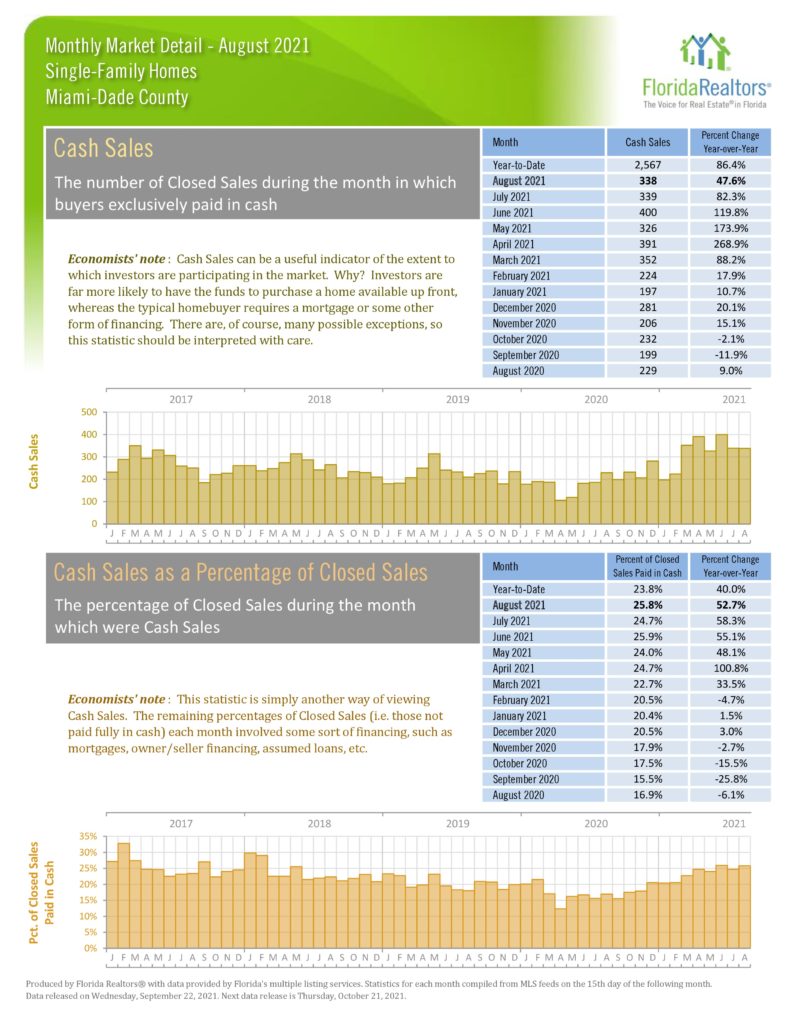
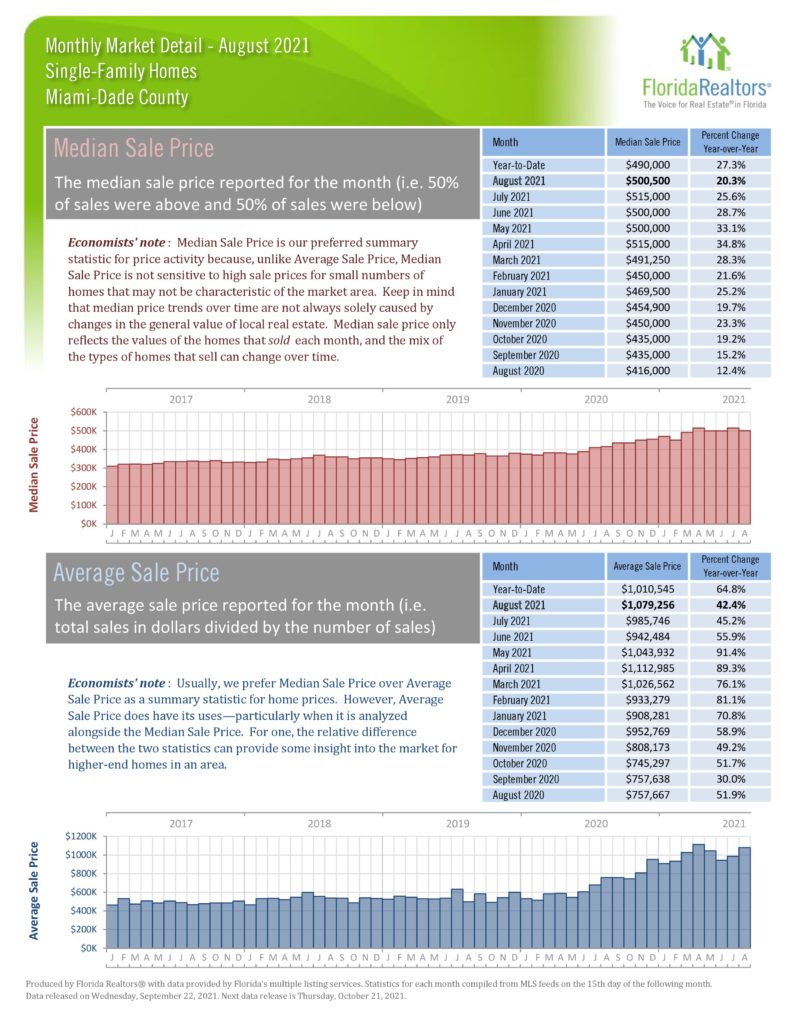
The speculation that condo sales would be negatively affected did not happen as the majority of the closed sale in August went under contract in July. Condo sales were up 70% and dollar volume up 129% but comparing to August 2019 – pre-pandemic – the numbers are still very strong, sales up 64% and volume up 145%. Condo median price up 26.4% – Single Family up 20.3%. With such demand and tight supply prices are doing what would be expected.
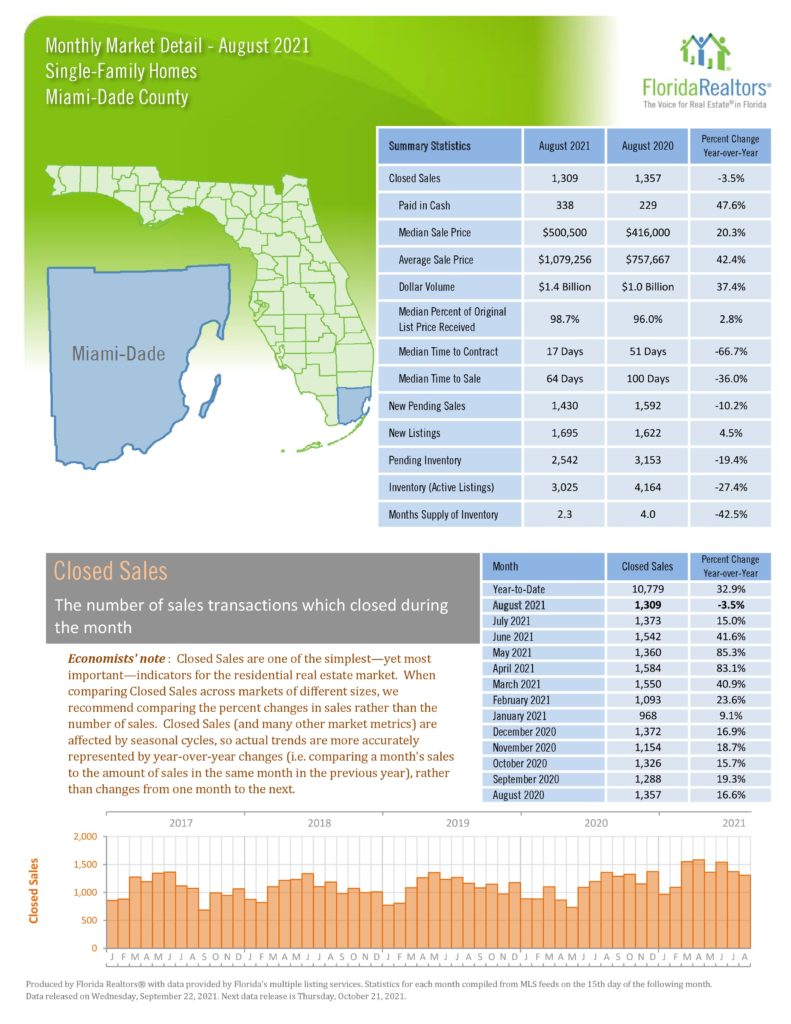
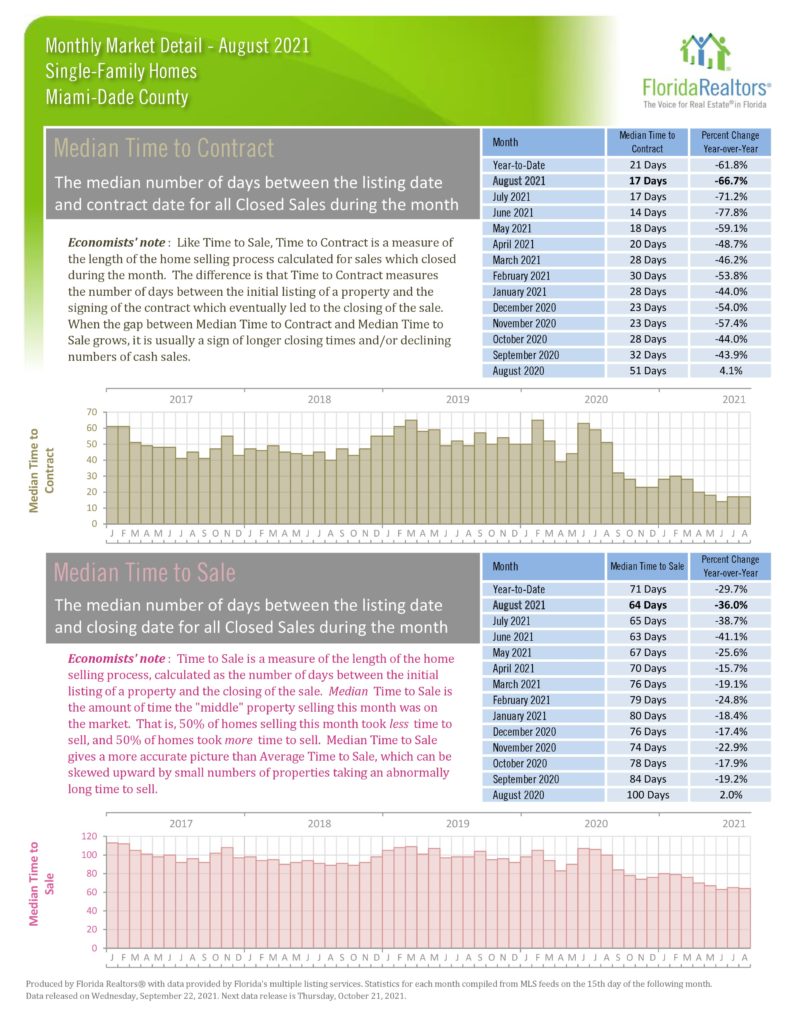
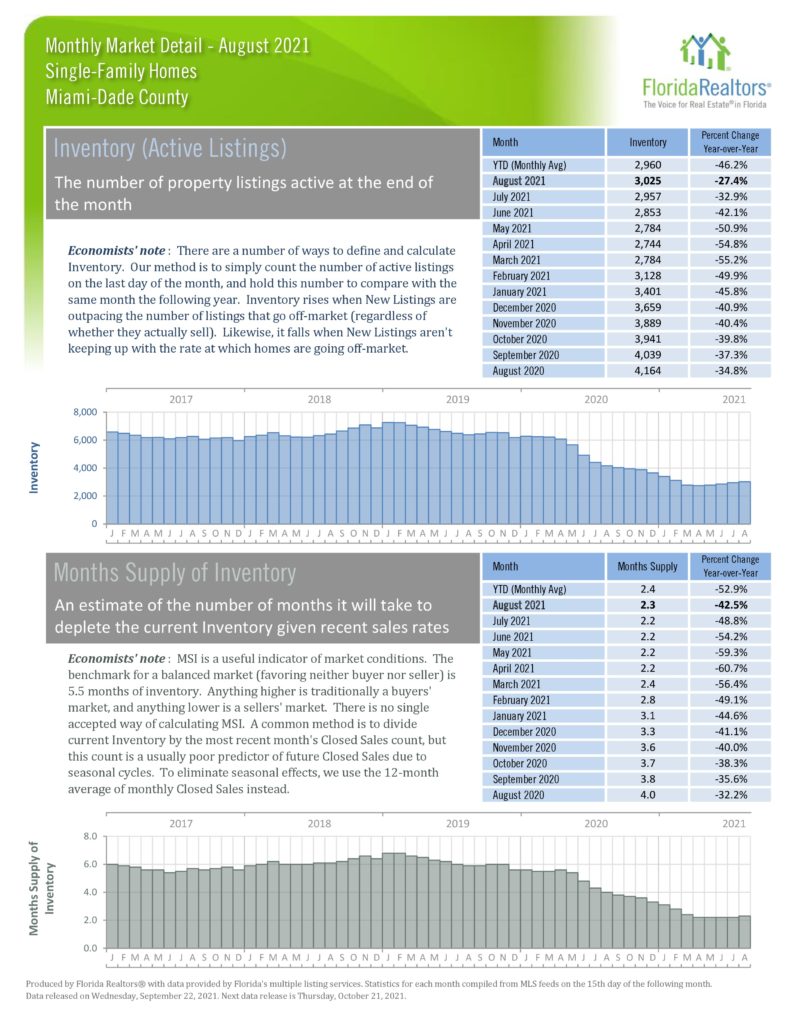
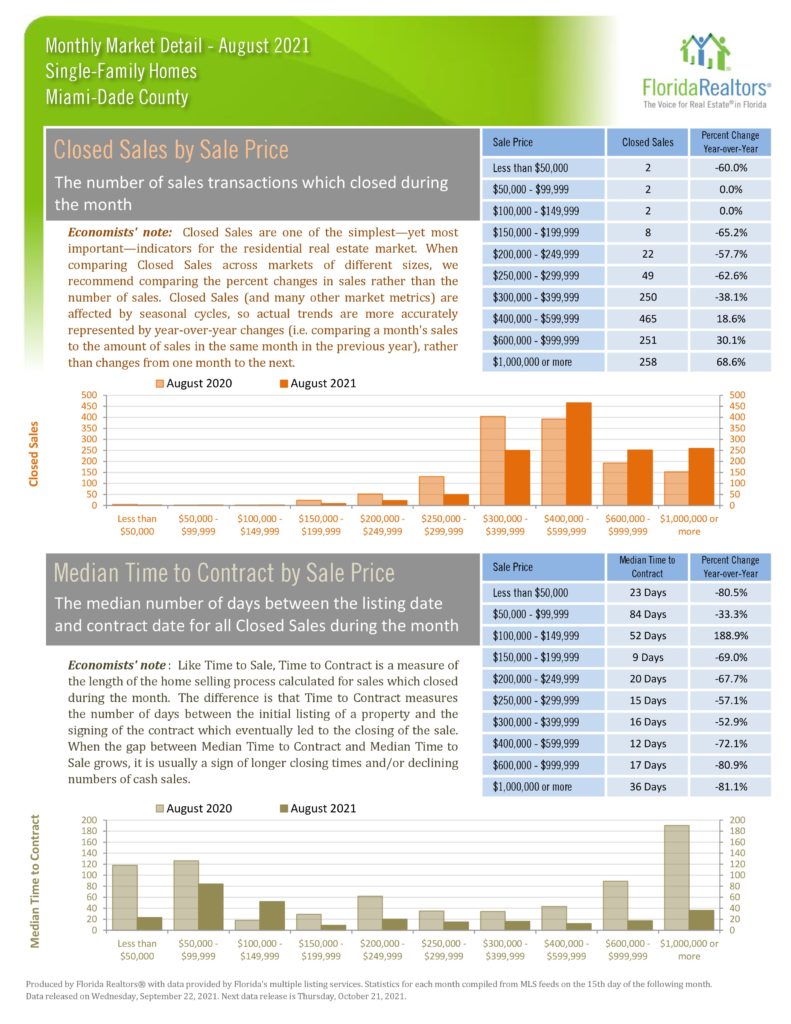
Single Family inventory is way down with only a 2.3 month supply causing a slight dip of 3.5% in closed sales.
Condos sales over $1 million were up 217%.
There is strong demand for Miami real estate from the Tech and Finance industries, people looking to pay less in taxes and those in search of a great quality of life…. It’s here!

KEY NUMBERS (Compared to August 2020)
  • Number of Condo Sales Up 70.1% YTD 114.6%
  • Number of Single Family Sales Down 3.5% YTD Up 32.9%
  • Median Condo Price – Up 26.4% YTD 23.1%
  • Median Single Family Price Up 20.3%
  • Closed Dollar Volume
    • Condos $1.1billion Up 129%
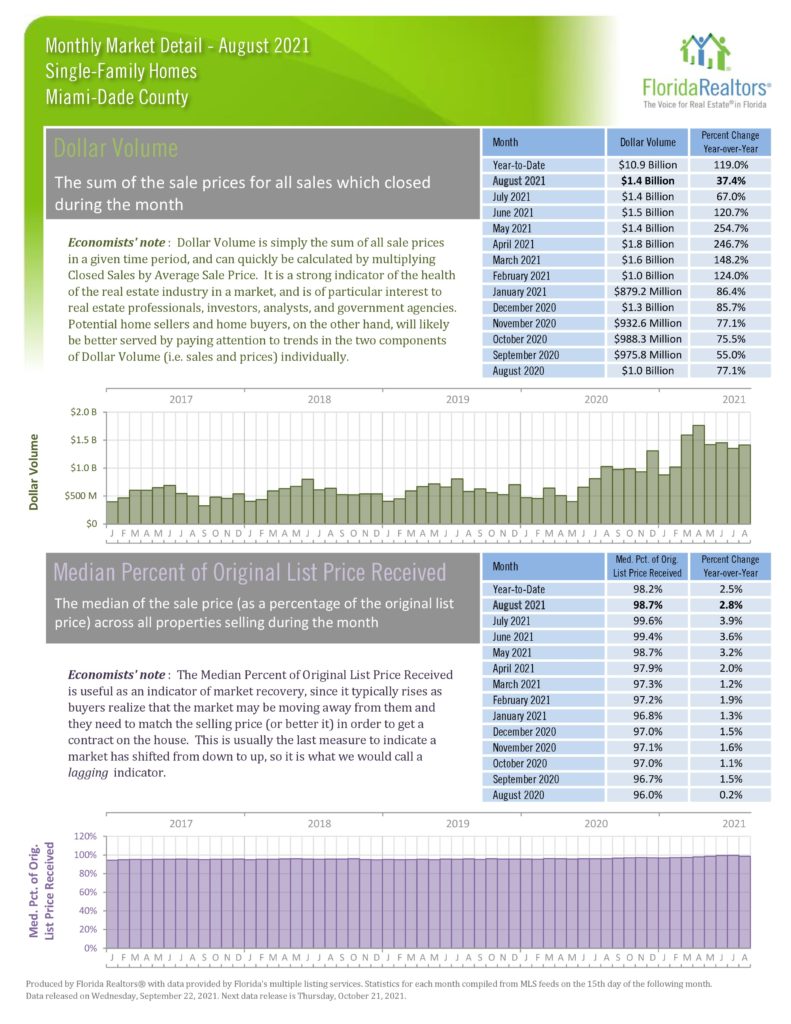
    • SFH $1.4billion Up 37.4%

Statistics about traditional, foreclosure/REO, and short sales. One is done over closed sales percentages. The other is done over median sale price.

Statistics chart for new listing by initial listing price and inventory by current listing price.

Statistics chart for closed sales by sale price and median time to contract by sale price.

Statistics chart for inventory (active listings) and month’s supply of inventory. Both have year-to-date (monthly average) and monthly statistics.

Statistics chart for new pending sales and new listings. Both have year-to-date and monthly statistics.

Statistics chart for median time to contract and median time to sale. Both have year-to-date and monthly statistics.

Statistics chart for dollar volume price and median percent of original list price. Both have year-to-date and monthly statistics.

Statistics chart for median sale price and average sale price. Both have year-to-date and monthly statistics.

This image requires alt text, but the alt text is currently blank. Either add alt text or mark the image as decorative.

This image requires alt text, but the alt text is currently blank. Either add alt text or mark the image as decorative.

Share:

Copyright ©. No guarantee, warranty or representation of any kind is made regarding the completeness or accuracy of descriptions or measurements including but not limited to square footage, room count, number of bedrooms, or designated school, and should be independently verified and expressly disclaim any liability in connection therewith. While, information from this website including market statistic data is believed to be correct, it is represented subject to errors, omissions, changes or withdrawal without notice. All material presented herein is intended for information purposes only. No financial or legal advice provided. Equal Housing Opportunity.