Miami Real Estate Report, January 2023 Statistics
KEY NUMBERS (Compared to January 2023)
- Number of Condo Sales – Down 50.6%
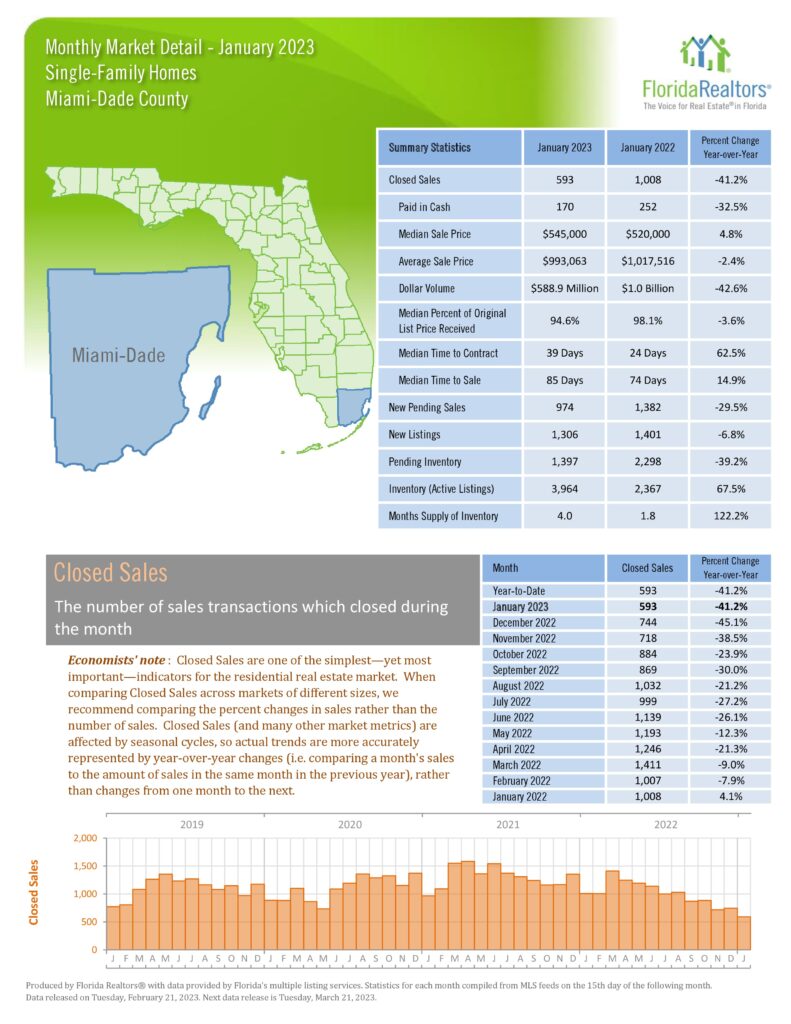
- Number of Single Family Sales – Down 41.2%
- Median Condo Price – Up 11.1%
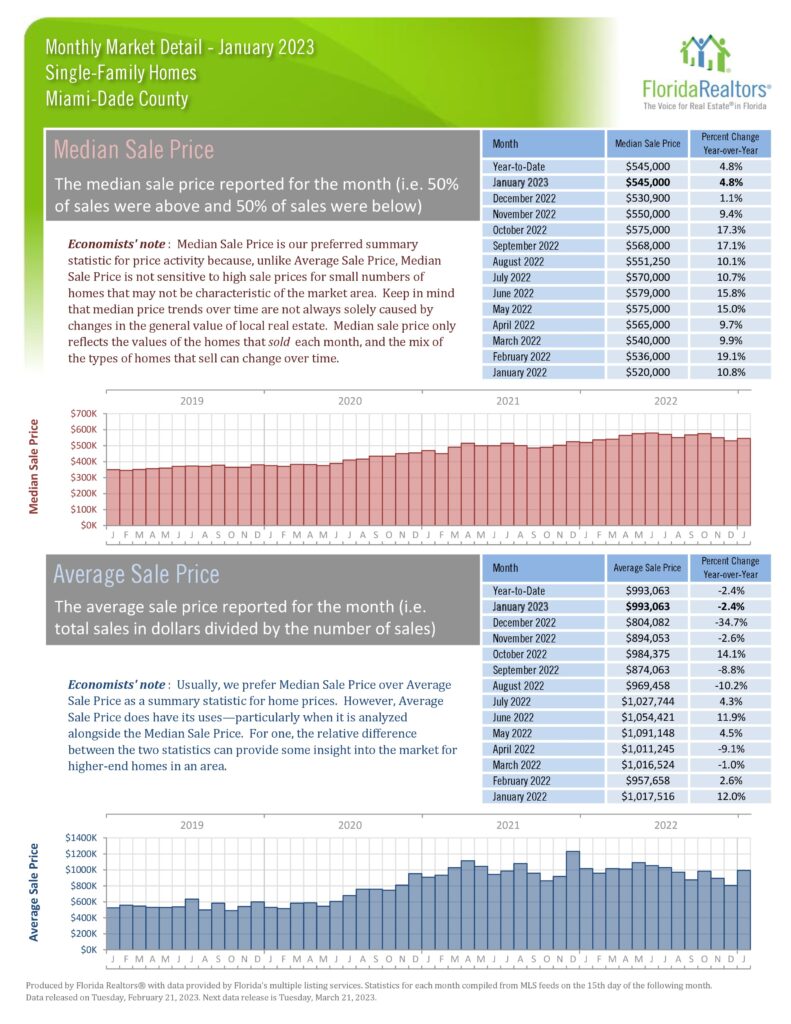
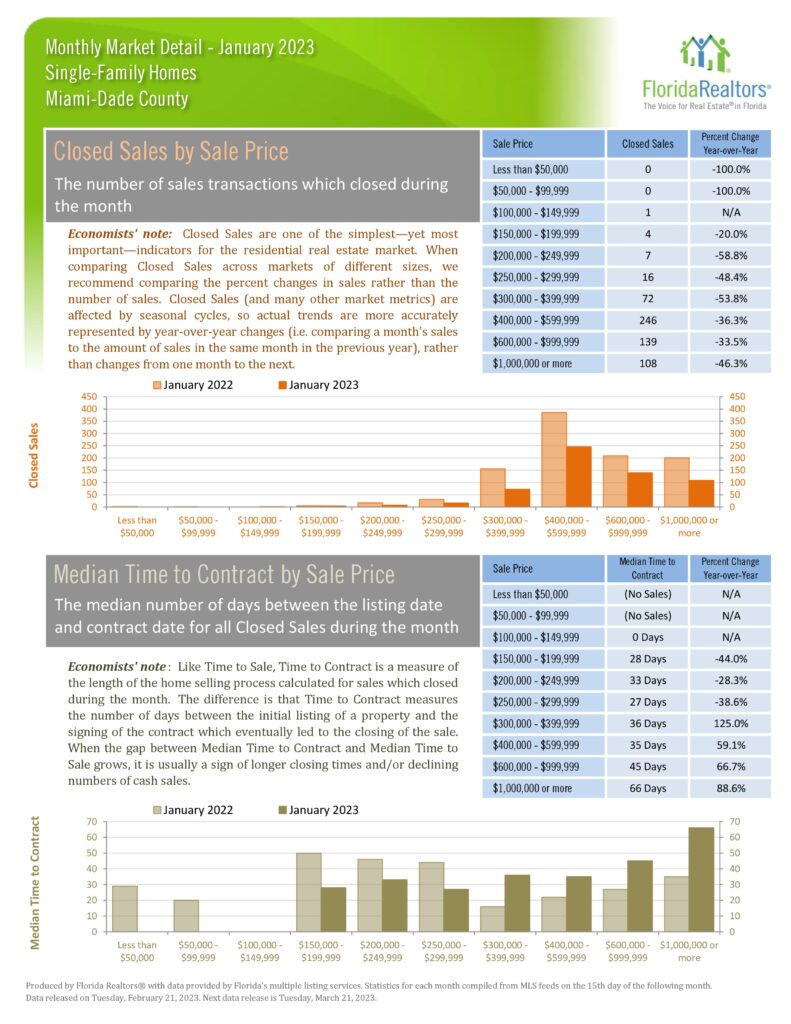
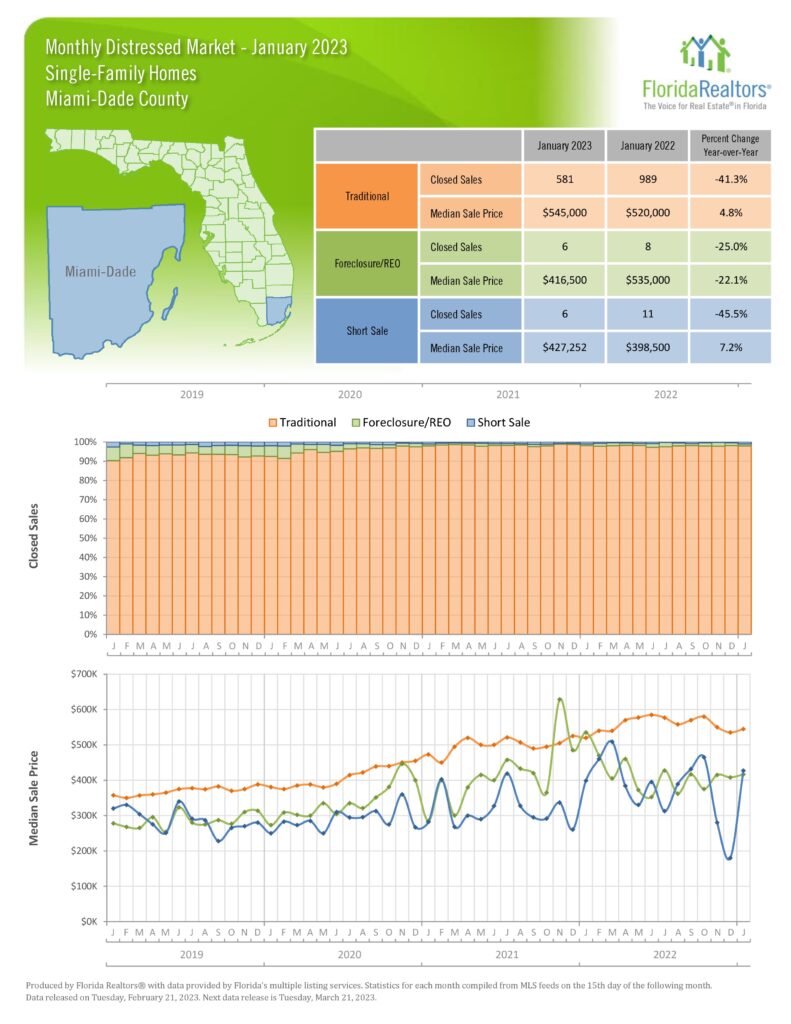
- Median Single Family – Price Up 4.8%
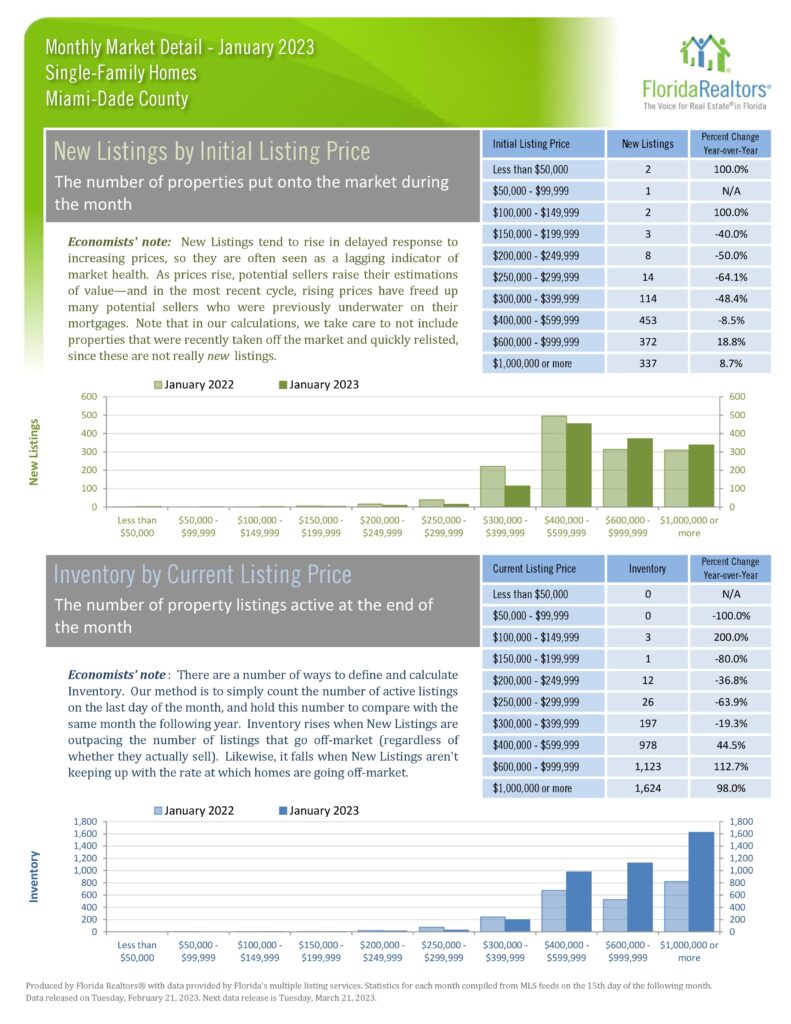
- Inventory
- Condos up 15.2%
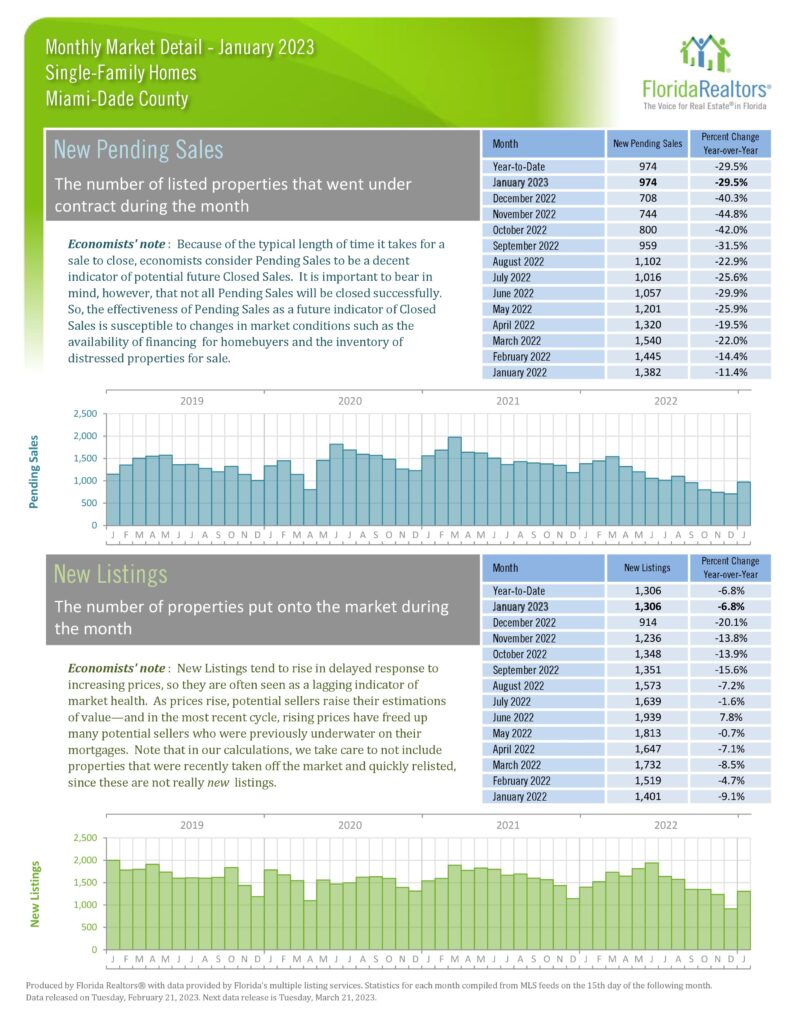
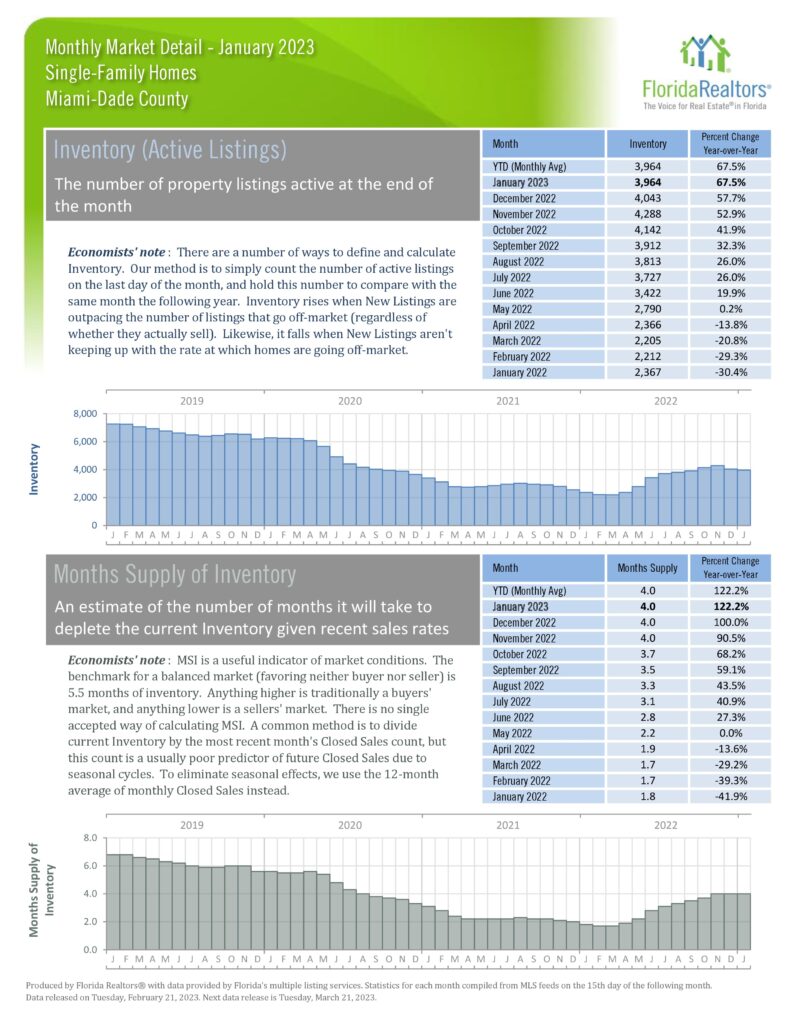
- SFH Up 67.5%
- Dollar Volume
- Condos Down 48.1%
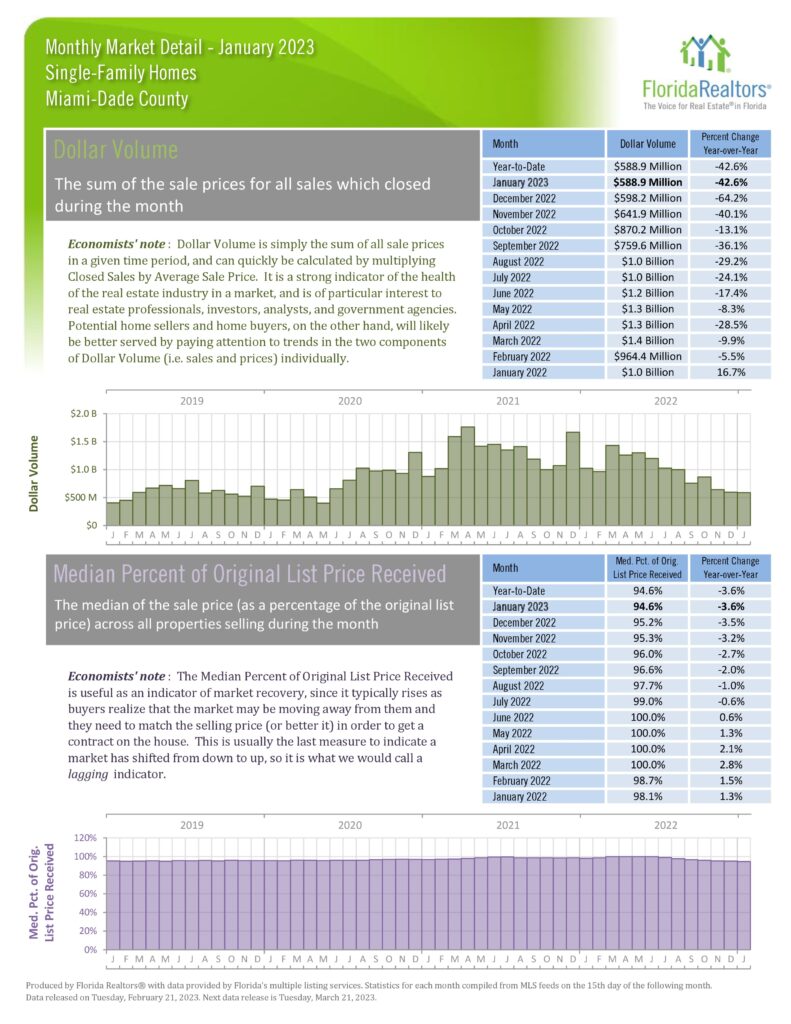
- SFH Down 42.6%
- Pending Inventory
- Condos Down 49.5%
- SFH Down 39.2%
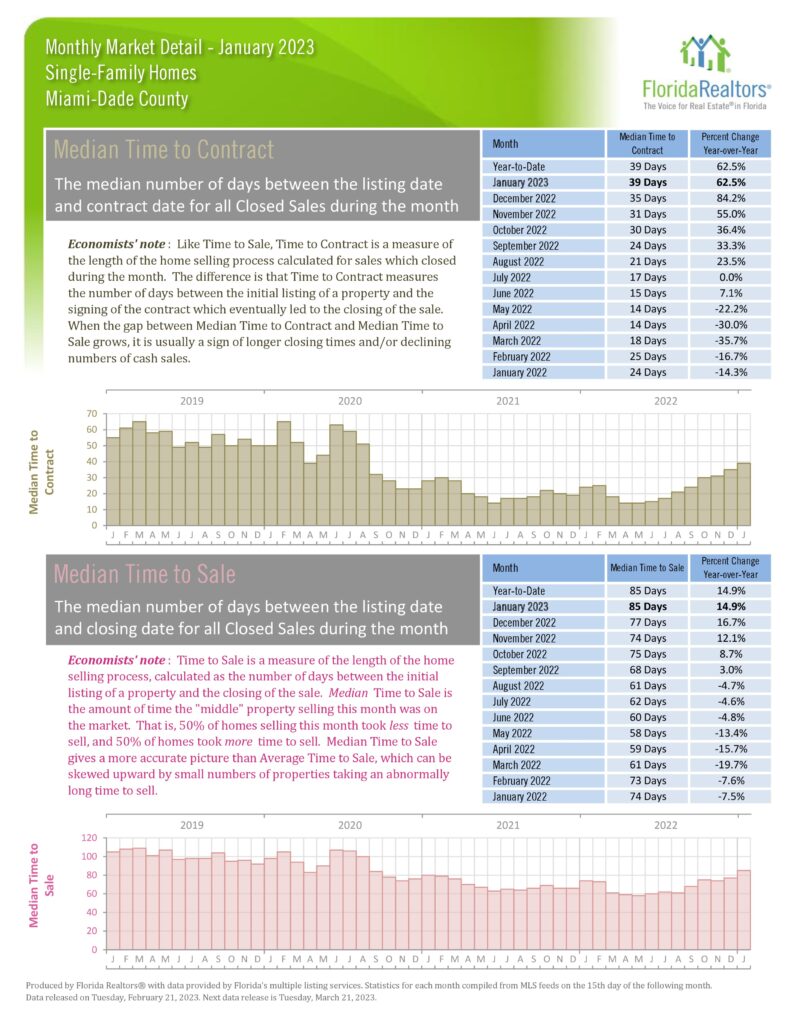
January, in any market, is typically a slower month for closed sales as most would have gone under contract in December when the focus is more on the holidays. But irrespective, we are in a slower market. Closed sales are down, dollar volume is down and the inventory of pending sales – properties under contract – is down which translates to closings being down going forward. County wide, Median prices are still increasing but at a milder rate than in the pandemic gold rush which certainly was needed. A statistic that caught me off guard was that the median price for condos in Miami Beach was 6.9% lower in Q4 22 than in Q4 21. The median price is the midpoint of the price ranges of all the closed sales – half are priced lower and half higher. Digging into the numbers I saw that in Q4 21 there were sales of $48million and 2 in the $30 million range and 8 between $10 and $16million but in Q4 22 the highest was $17.7 million and then only 6 sales between $10 and $11.5 million. That is what brought the mid-point price – Median Price – lower, not the values of existing properties going down.
In general, we still have listings lingering on the market that need to lower their prices but we’re seeing realist sellers entering the market with realistic prices. Activity is picking up.