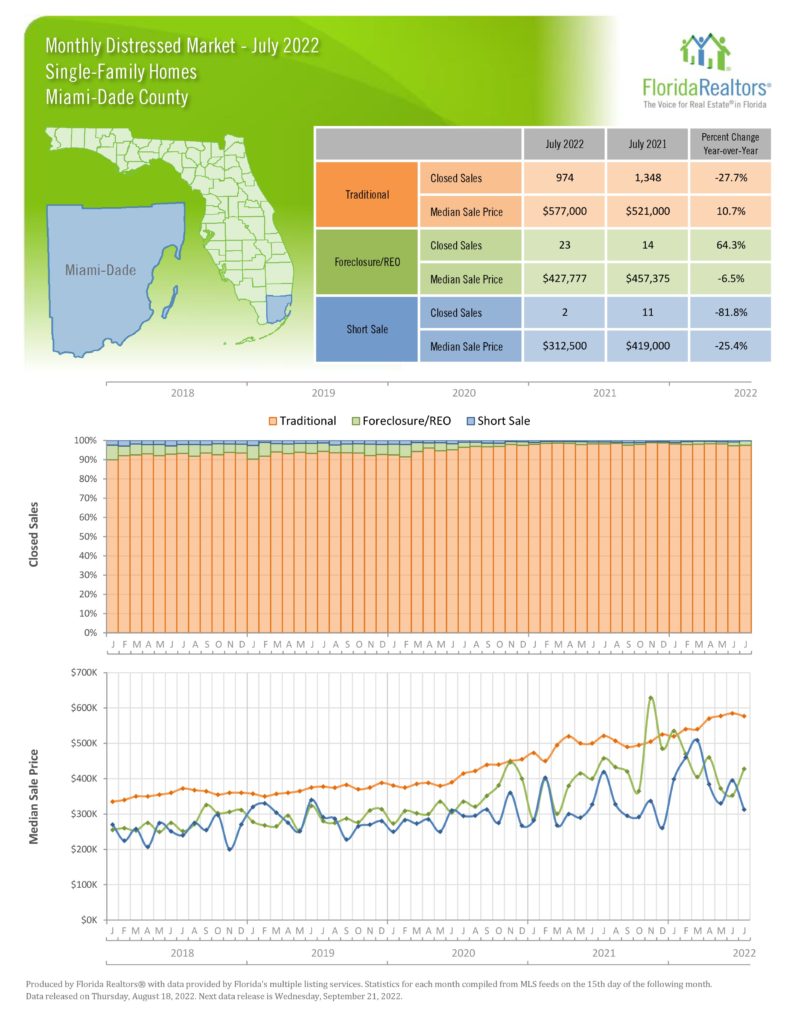
Miami Real Estate Report, July 2022 Statistics

KEY NUMBERS (Compared to July 2021)

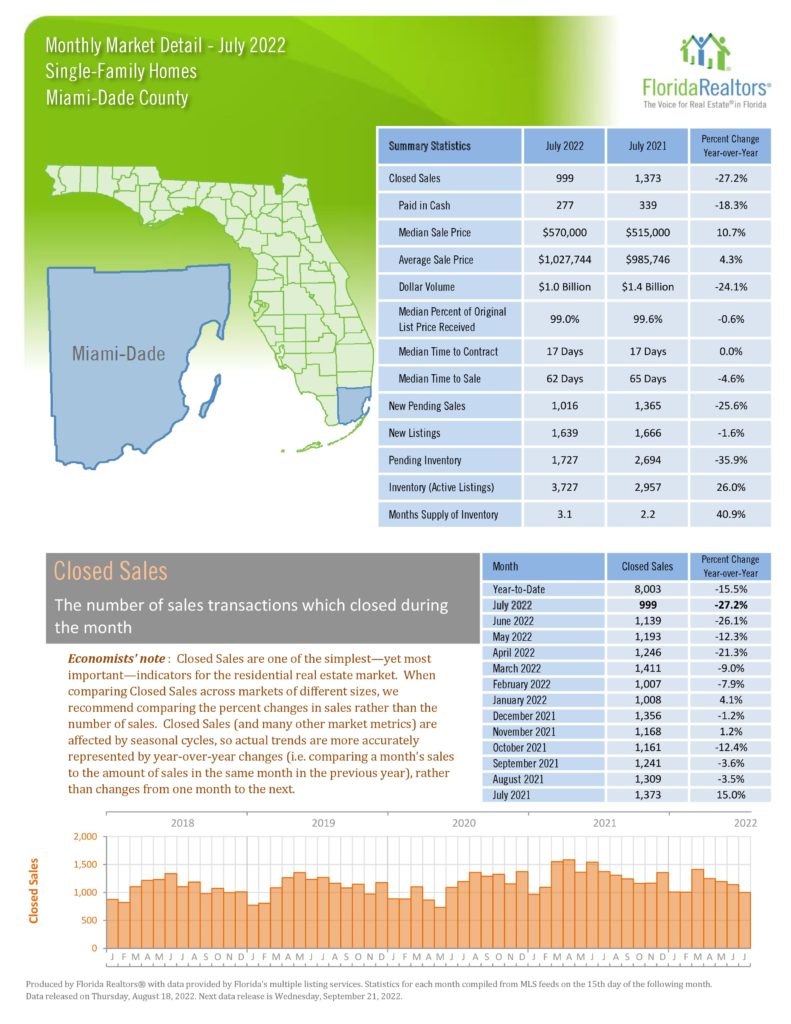
  • Number of Condo Sales Down 39.1%
  • Number of Single Family Sales Down 27.2%
  • Median  Condo Price – Up 11.8%
  • Median Single Family Price Up 10.7%
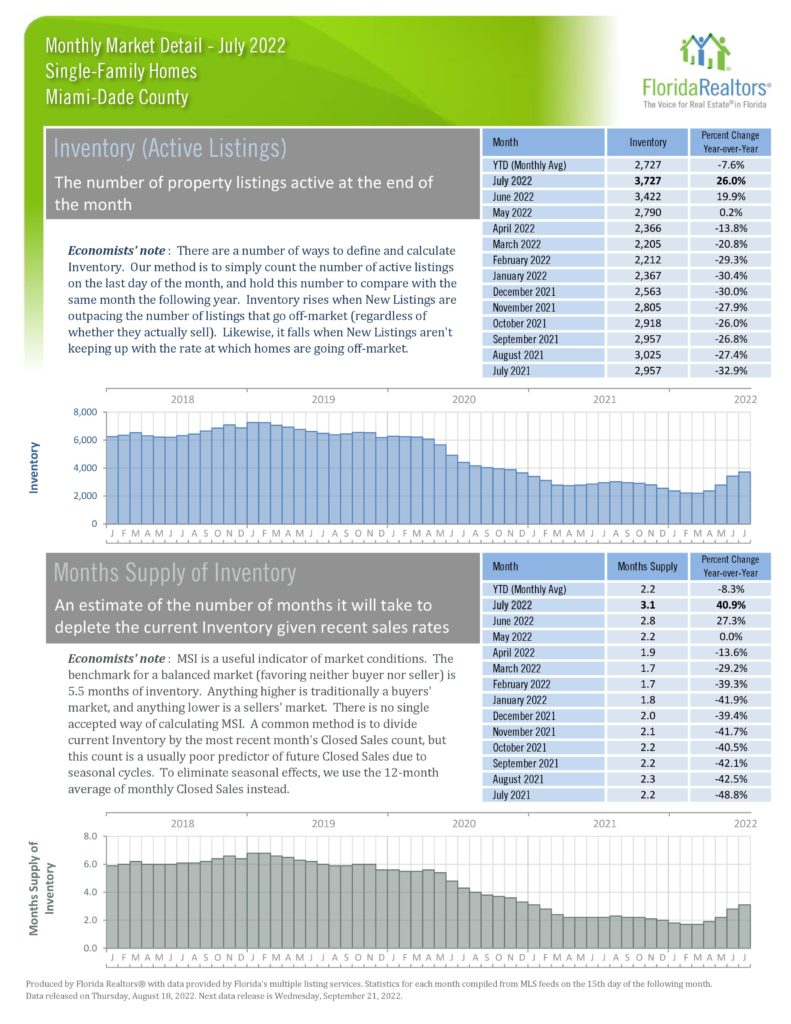
  • Inventory (Active Listings)
    • Condos Down 26.3%
    • SFH Up 26%

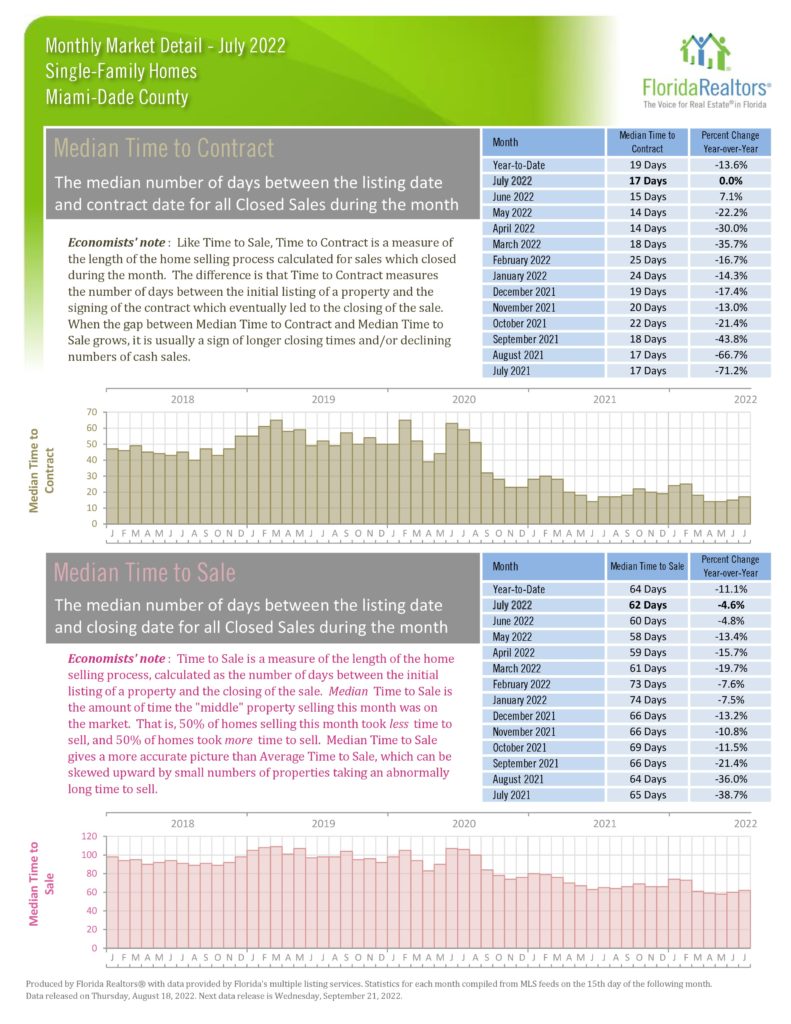
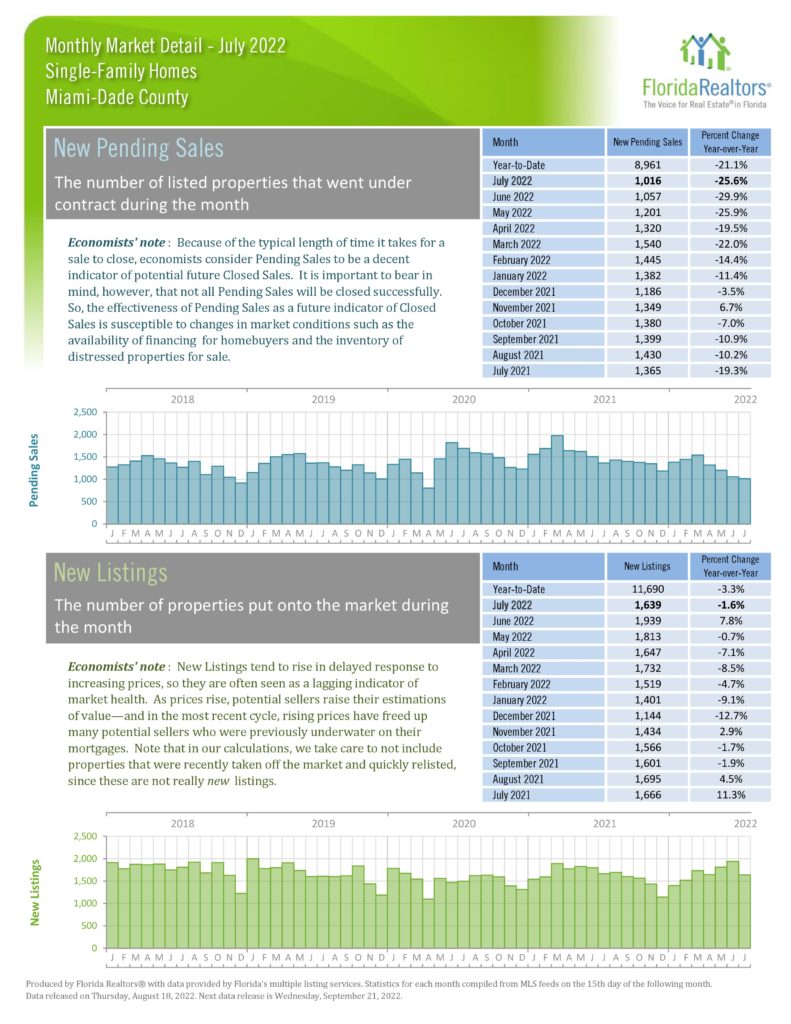
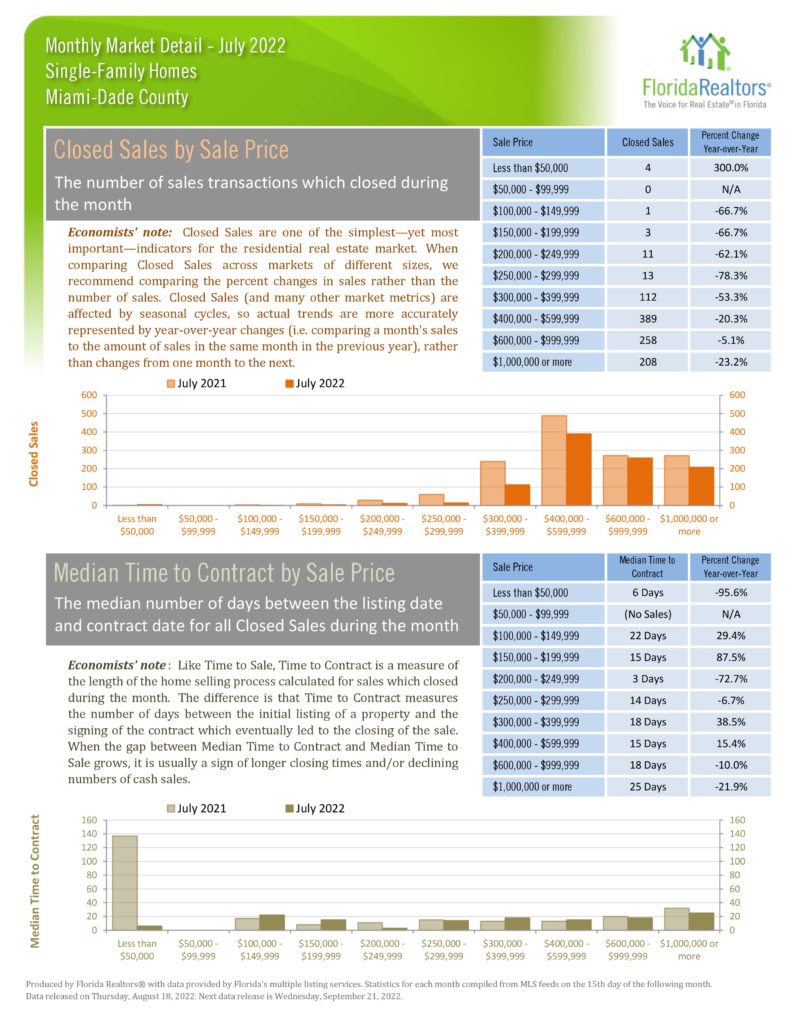
For more than two years of intense real estate sales, we are seeing a more normalized market. Total July sales of 2375 are down considerably from last July but the average number of July sales in years 2016-2019 was 2325. The condo median price was up 11.8% with single family up 10.7% also indicating more subdued price increases. With very low inventory and rising interest rates, single family sales were down 27.2% and condos 39.1% from last July. New condo pending sales were down 32.7%, with Listing Inventory down 26.3%. The median sale price compared to list was 99% for both single family and condos with days to contract being 17 and 20 respectively. Considering those numbers and the declines in pending sales, demand is still there and inventory increases seem more likely in the near future which will result in a more balanced market. Because of the high percentages of cash sales, 28.3% YTD for Single Family and 52% for condos, massive defaults are not likely, illustrating that this market is not totally reliant on borrowed money. In July foreclosures accounted for 1% of all condo sales and 2.3% single family with short sales being 0.02% for condos and single family.

Statistics about traditional, foreclosure/REO, and short sales. One is done over closed sales percentages. The other is done over median sale price. Statistics chart for new listing by initial listing price and inventory by current listing price. Statistics chart for closed sales by sale price and median time to contract by sale price. Statistics chart for inventory (active listings) and month’s supply of inventory. Both have year-to-date (monthly average) and monthly statistics. Statistics chart for new pending sales and new listings. Both have year-to-date and monthly statistics. Statistics chart for median time to contract and median time to sale. Both have year-to-date and monthly statistics. Statistics chart for dollar volume price and median percent of original list price. Both have year-to-date and monthly statistics. Statistics chart for median sale price and average sale price. Both have year-to-date and monthly statistics. Statistics chart for cash sales and cash sales as a percentage of closed sales. Both have year-to-date and monthly statistics. Summary statistics for all this month's statistics. Close sales statistics chart, with monthly changes and year-to-date numbers.

Share:

Copyright ©. No guarantee, warranty or representation of any kind is made regarding the completeness or accuracy of descriptions or measurements including but not limited to square footage, room count, number of bedrooms, or designated school, and should be independently verified and expressly disclaim any liability in connection therewith. While, information from this website including market statistic data is believed to be correct, it is represented subject to errors, omissions, changes or withdrawal without notice. All material presented herein is intended for information purposes only. No financial or legal advice provided. Equal Housing Opportunity.