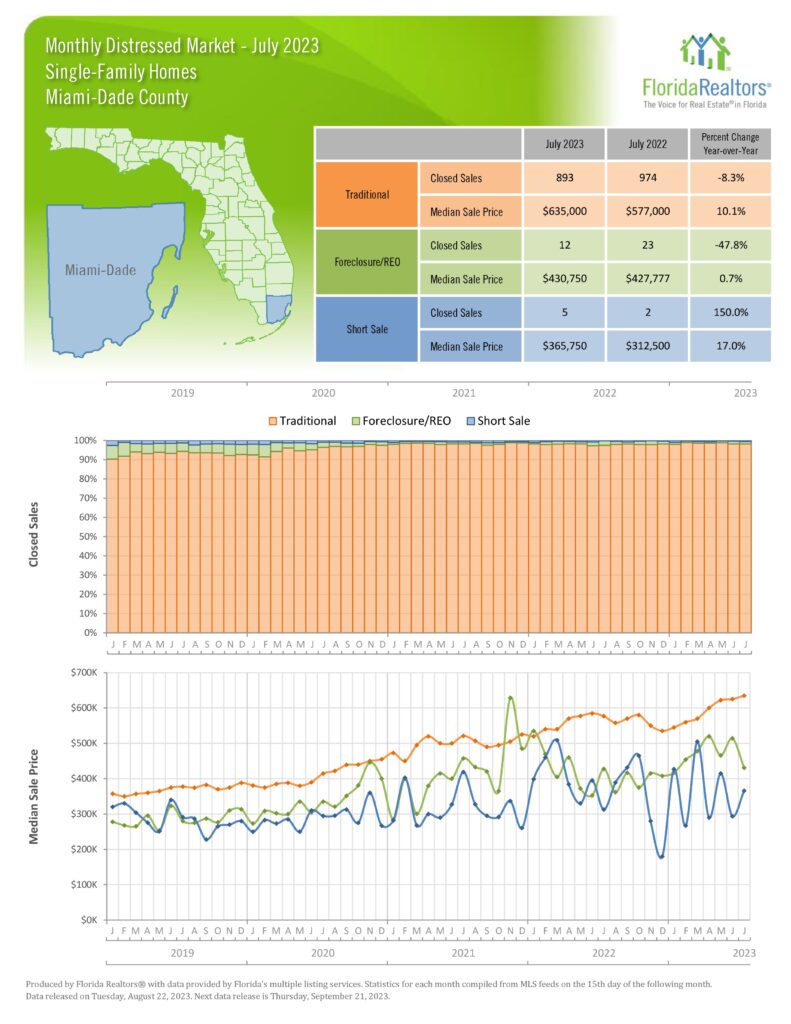
Miami Real Estate Report, July 2023 Statistics
KEY NUMBERS
(Compared to July 2022)
- Number of Condo Sales
- Down 17.1%
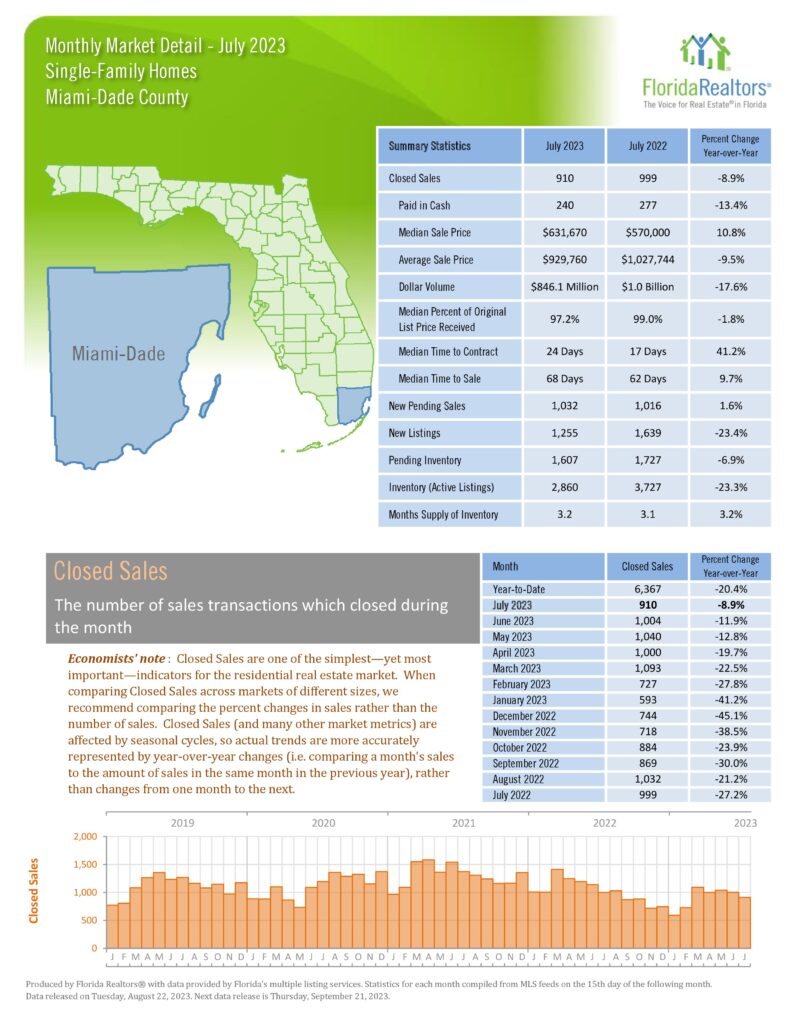
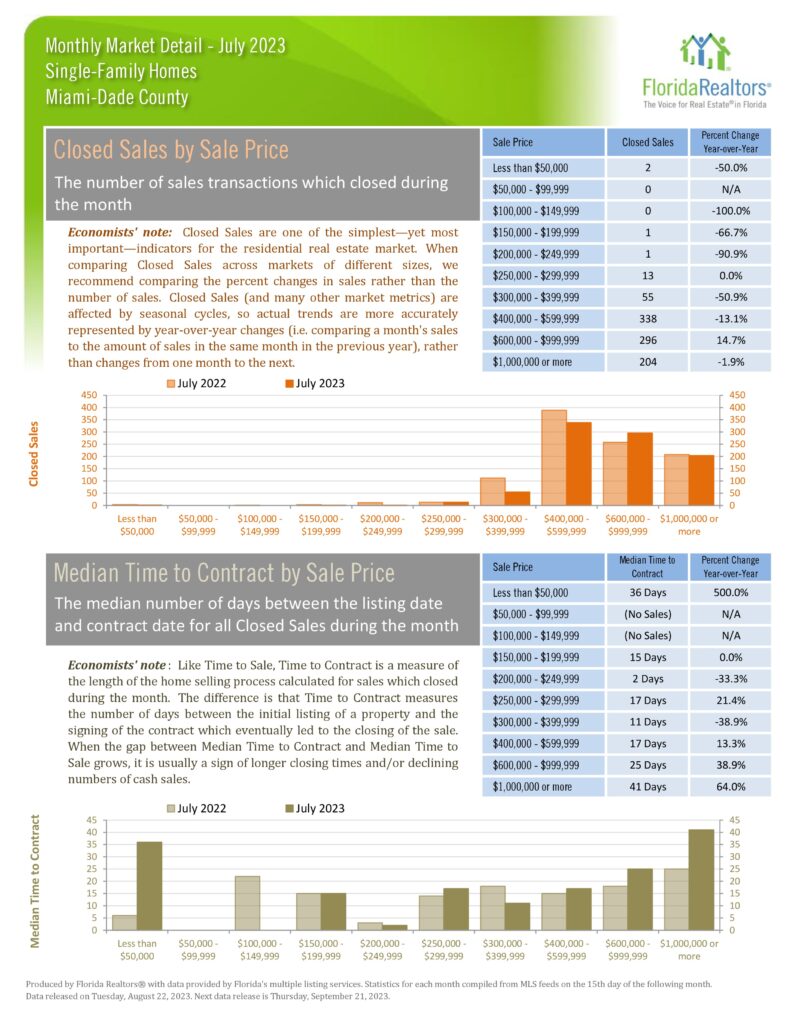
- Number of Single Family Sales
- Down 8.9%
- Median Condo Price –
- Up 10.5% & 5.1% YTD
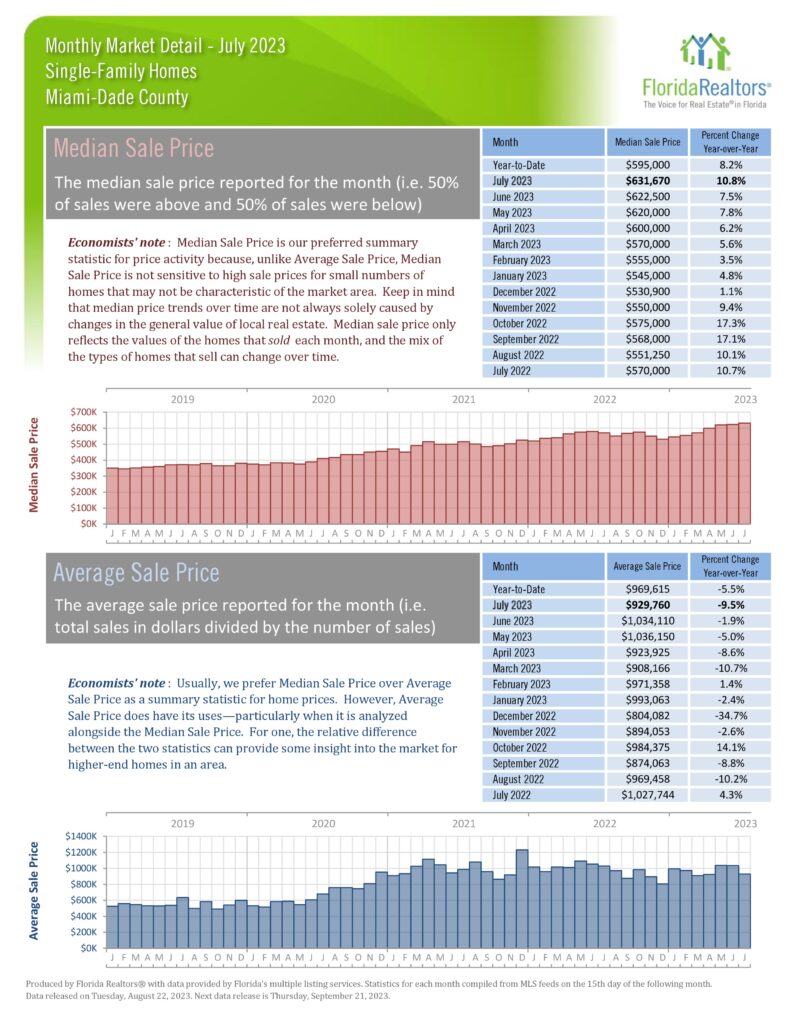
- Median SFH Price
- Up10.8% & 8.2% YTD
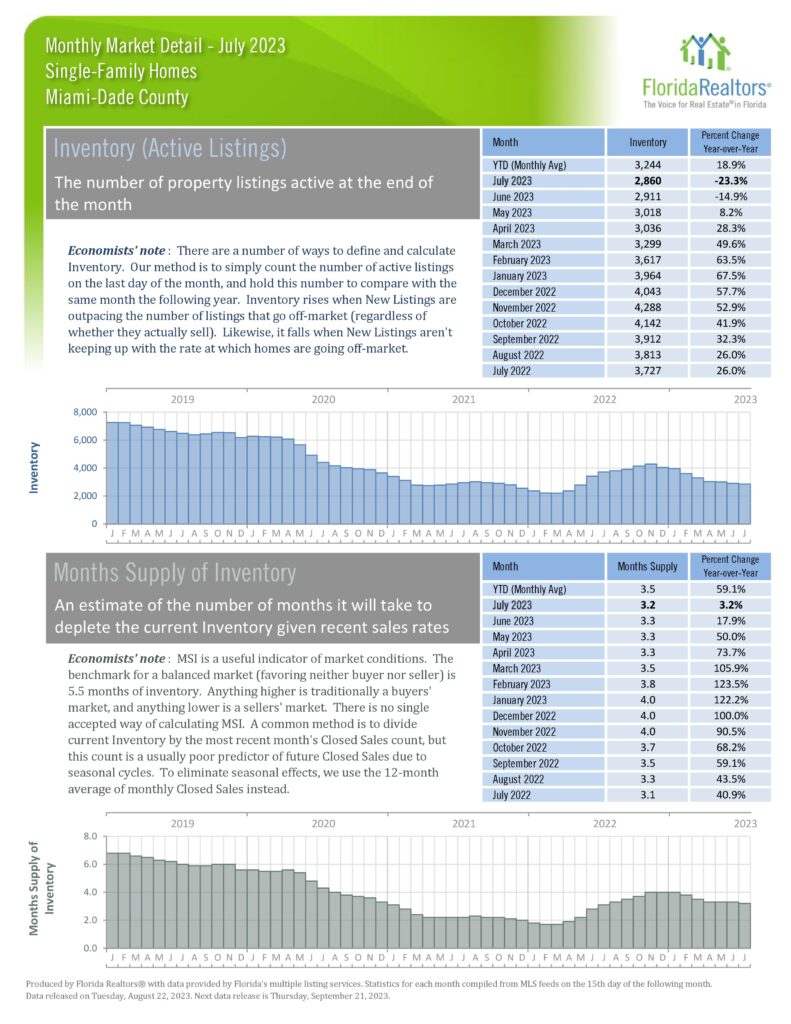
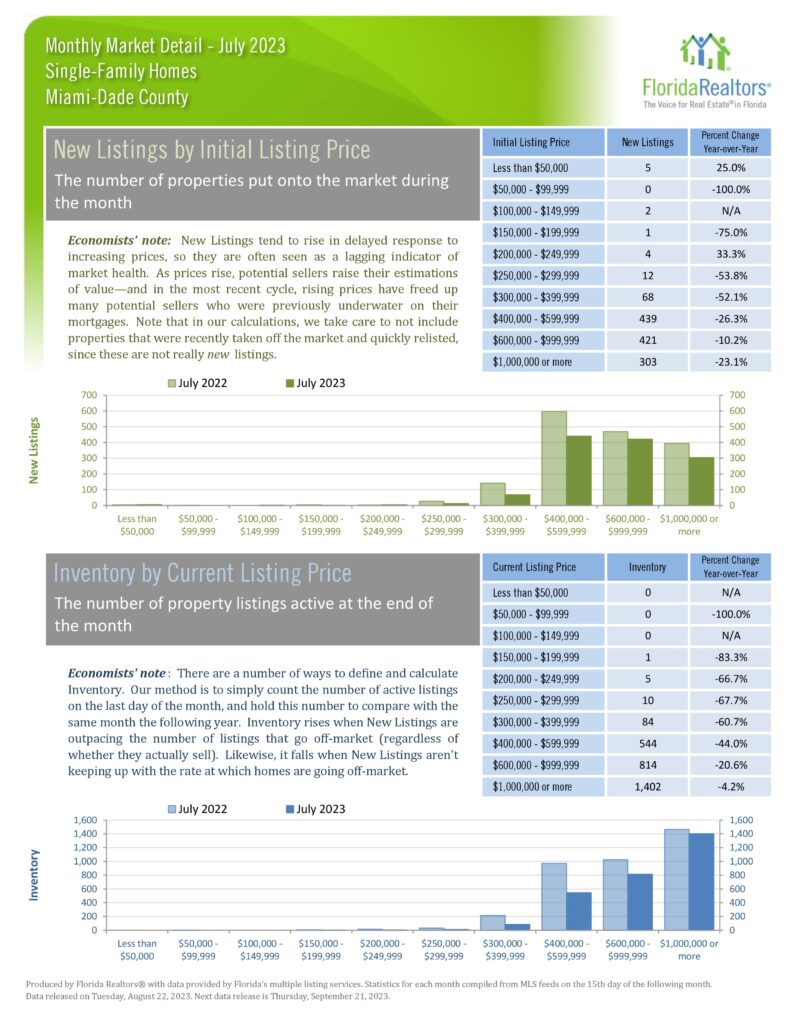
- Inventory
- Condos Down 2.3%
- SFH Down 23.3%
- Days On Market
- Condos 32 Days
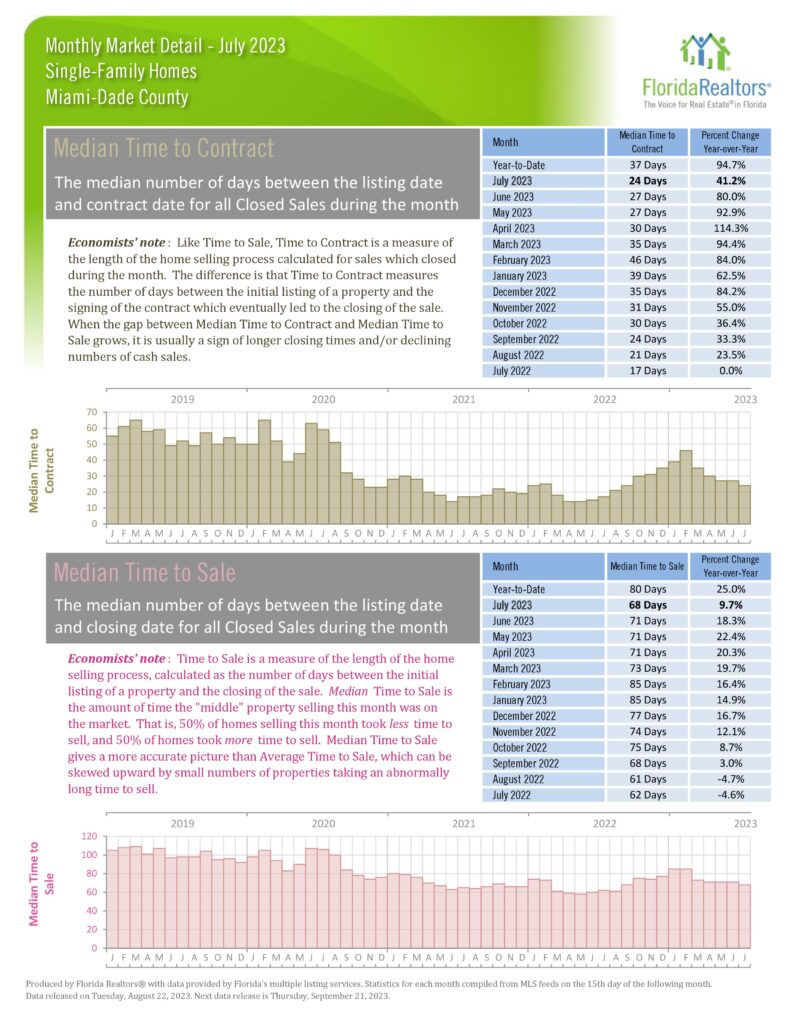
- SFH 24 Days
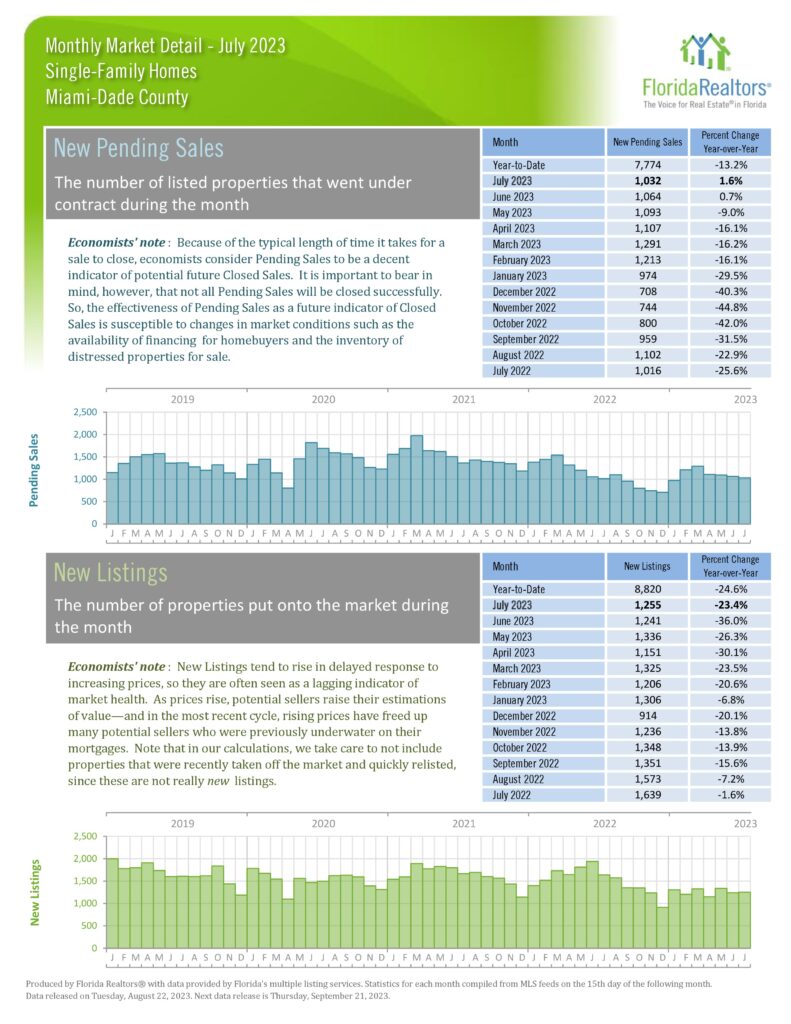
- Pending Inventory
- Condos Down 12.2%
- SFH Down 6.9%
Months Supply
- Condos 5.1 months
- SFH 3.2 months
Important indicators to keep an eye on:
Condo closed sales are closing in 32 days with prices up 10.5% Year Over Year and 5.1% Year To Date.
Single Family Homes closed in 24 days and are up 10.8% Y-O-Y and 8.2% YTD. Those are very strong numbers for a market that many predicted to be crashing. They certainly got that wrong!
The total closed sales, because of existing demand, would be higher if:
- We had more inventory and,
- More Sellers would price their properties realistically. The Sellers that do price realistically, sell, and sell rather quickly, while the over priced listings linger on the market.
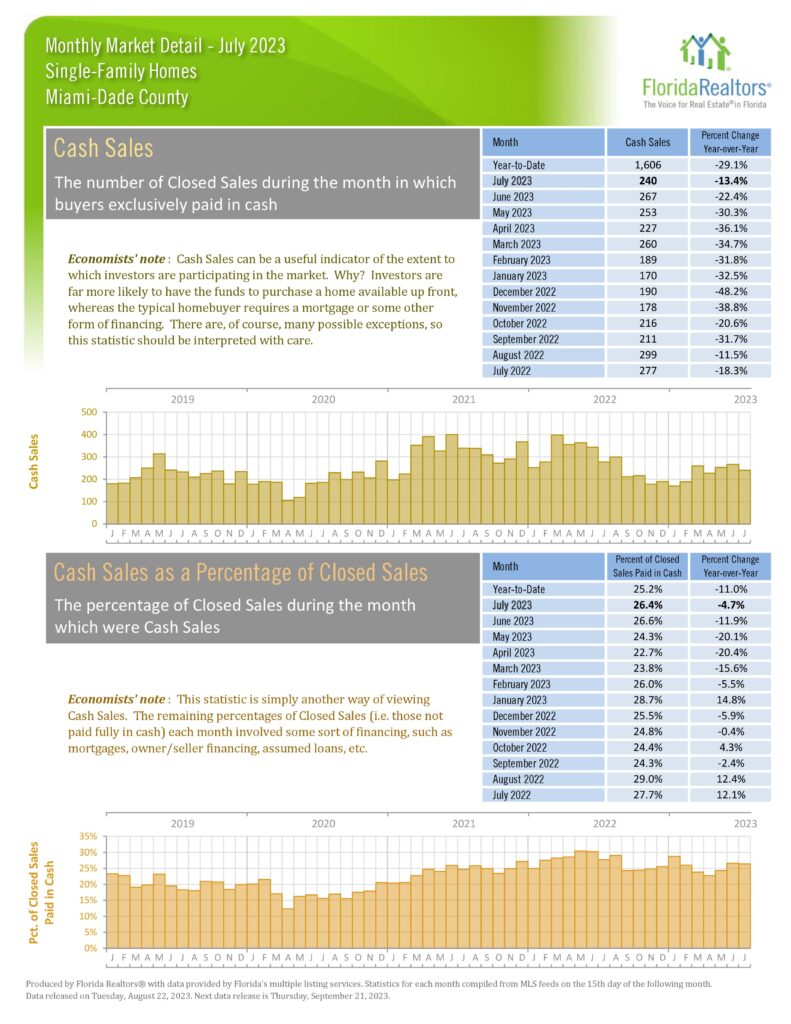
Distressed sales are virtually non-existent. Condo REO’s (foreclosures) were 0.7% of the closed sales and short sales were 0.1%. With Single family having 1.3% REOs and 0.5% short sales. Inventory is still down Y-O-Y but the YTD monthly averages are up some, but we do need more inventory.
If you’ve considered selling, call us!