Miami Real Estate Report, September 2021 Statistics

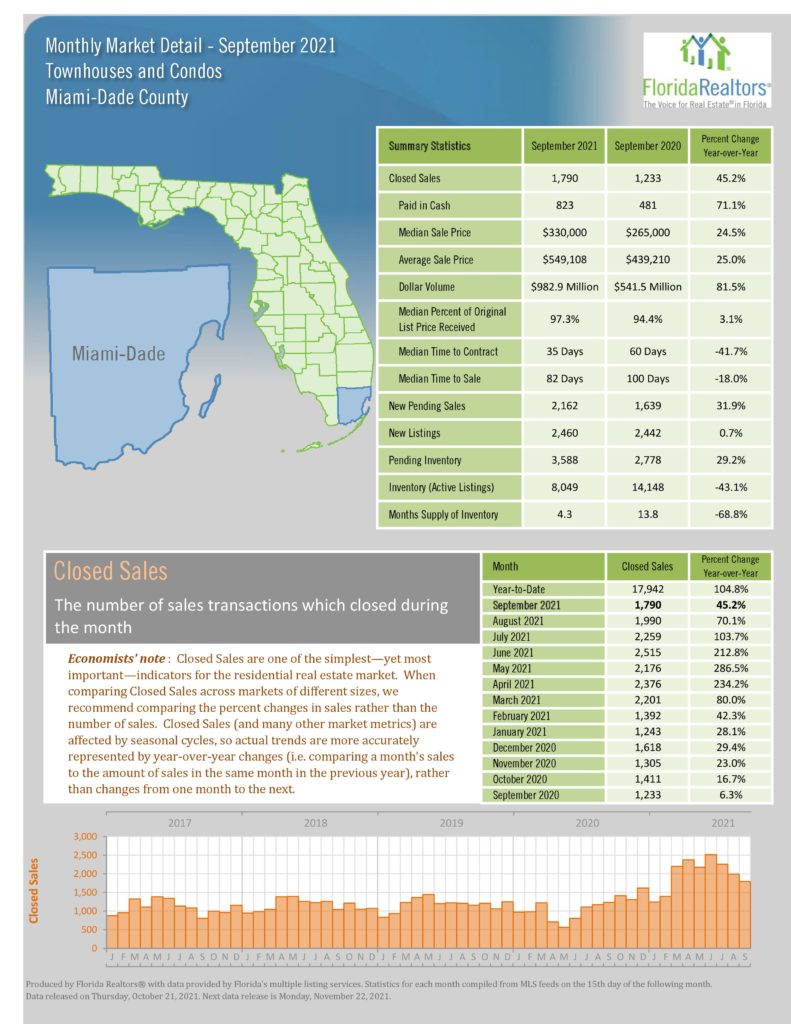
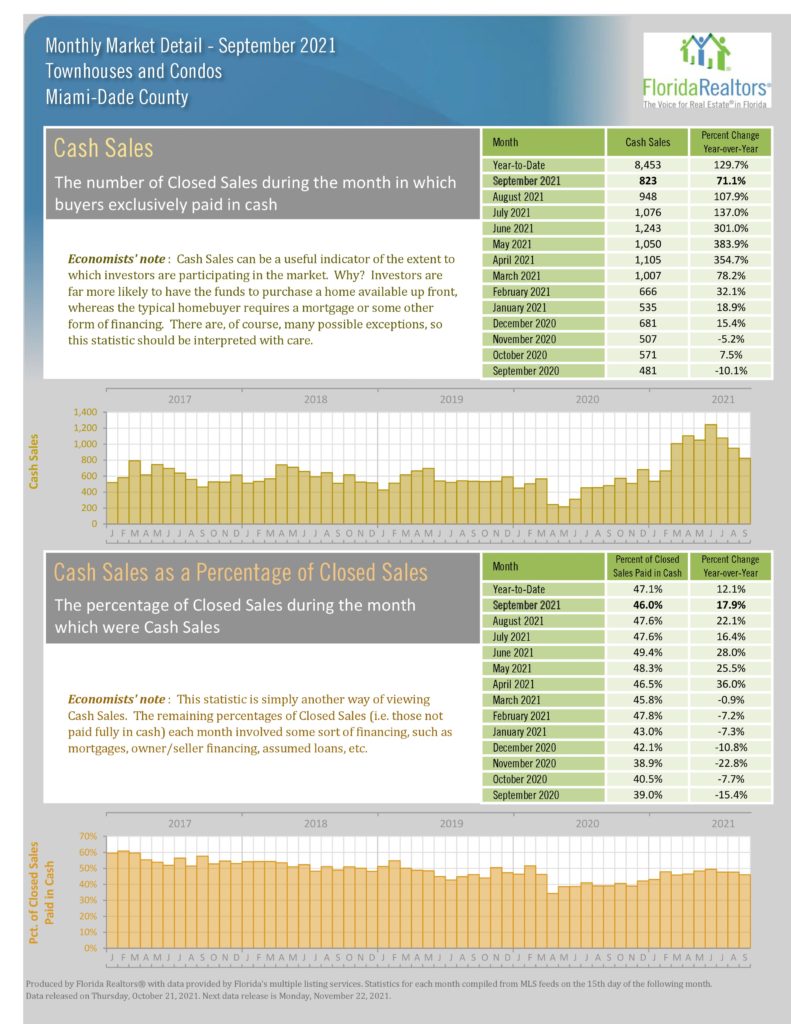
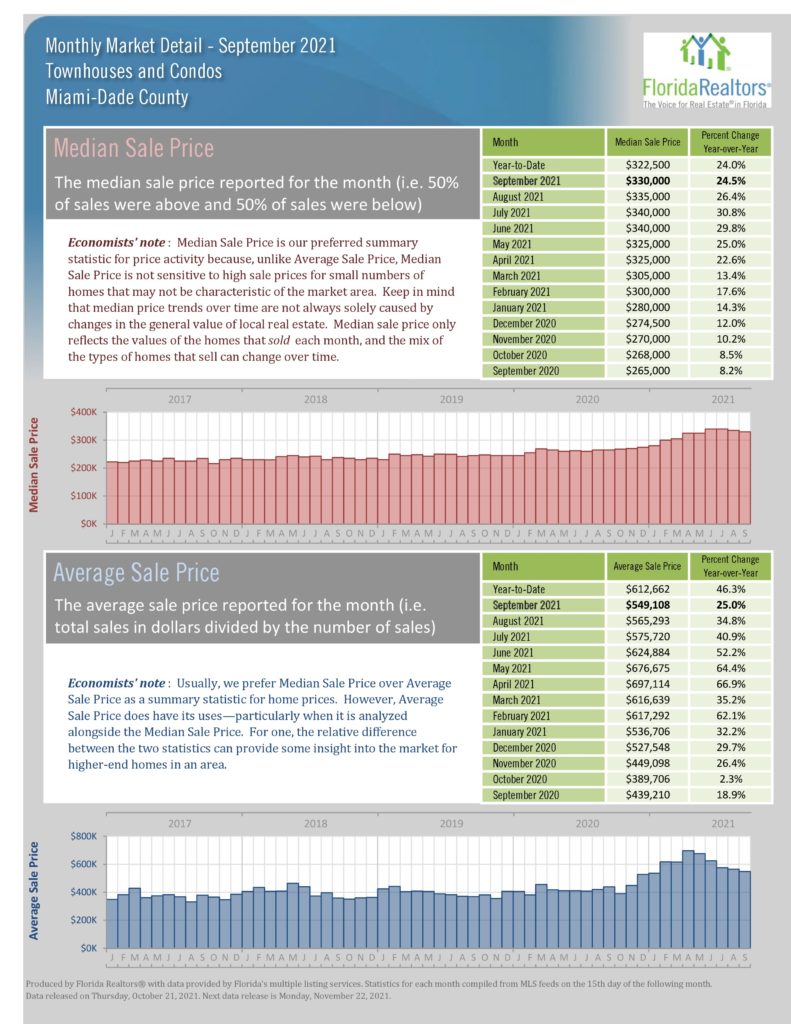
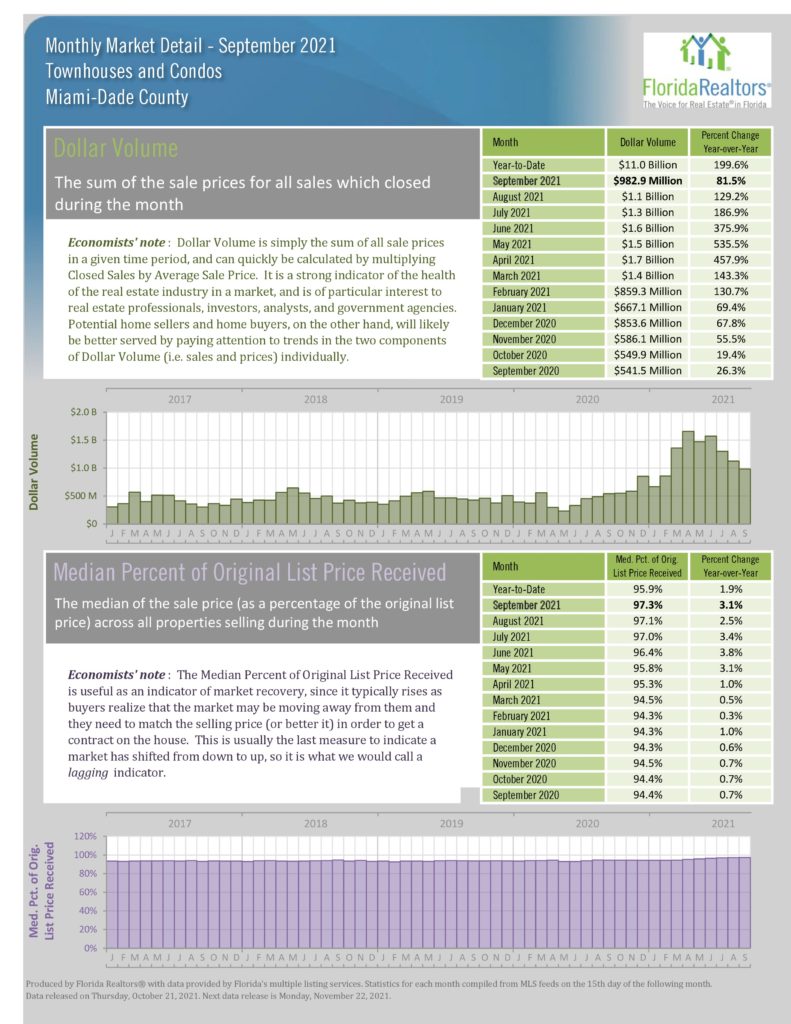
As predicted, we still have a very strong market compared to 2020 and 2019 but the intense past appears to be easing up. Condo sales are up 45.2% over last September and 105% YTD but compared to last month, down 11% with Median prices up 24.5% from last year and 24% YTD but down 1.5% compared to last month with the same trend for average prices and dollar volume. Single Family Closed sales are slightly down because of the low inventory. The Median price is up 11.5% over last September and up 25.6% YTD but compared to last month there were dips in the Median Price of 3%, Average Price of 8.7% and dollar volume 14.3%.  Good news for sellers – values are up substantially over last year. Good news for Buyers – the, rapid increases in prices appears to be waning. It’s a good time to sell and with interest rates at an all-time low, a good time to buy.  affects you.

KEY NUMBERS (Compared to September 2020)
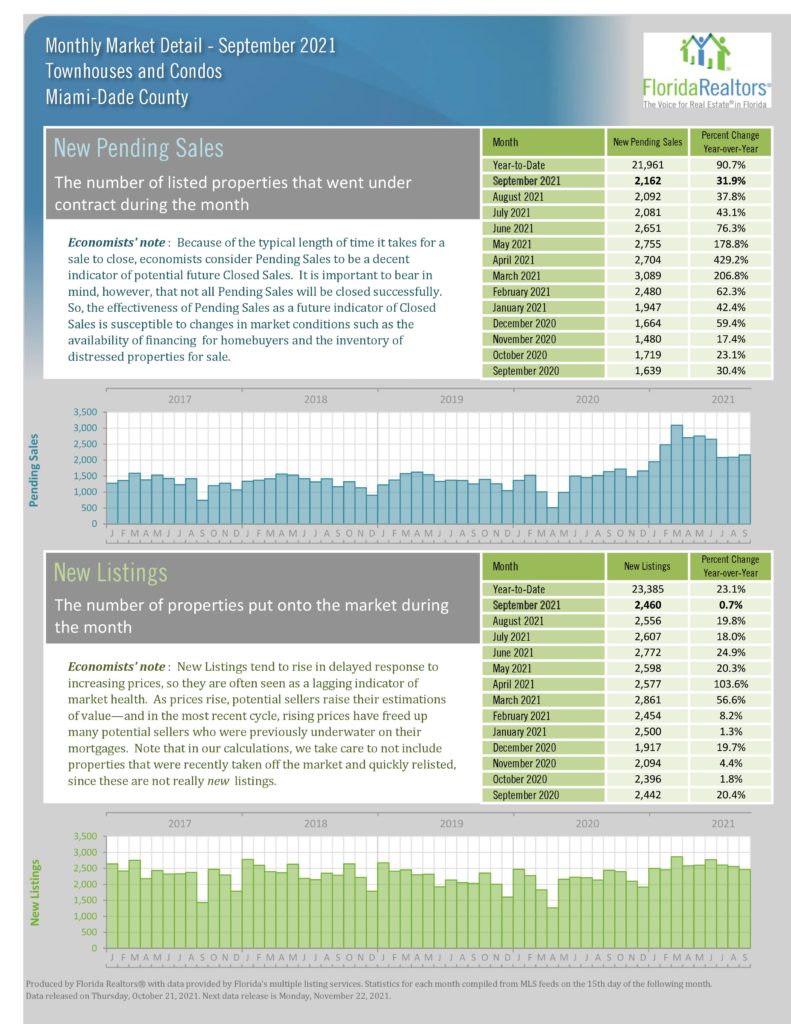
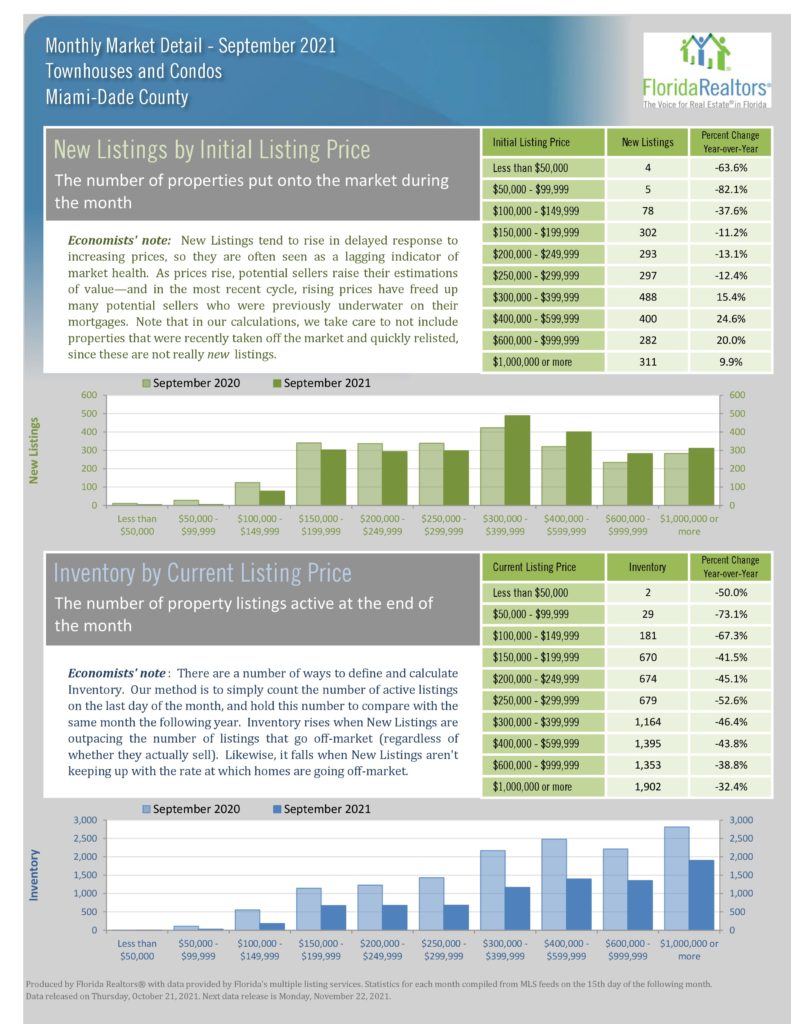
  • Number of Condo Sales Up 45.2% YTD 104.8%
  • Number of Single Family Sales Down 3.6% YTD Up 27.9%
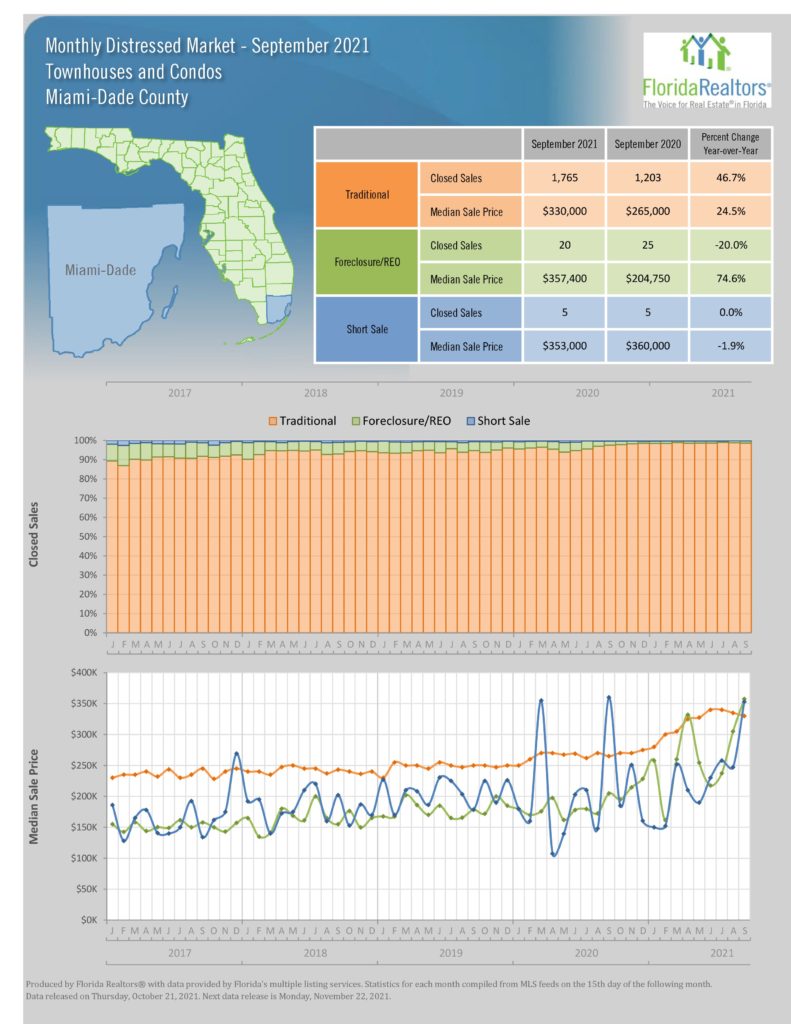
  • Median  Condo Price – Up 24.5% YTD 24%
  • Median Single Family Price Up 11.5%
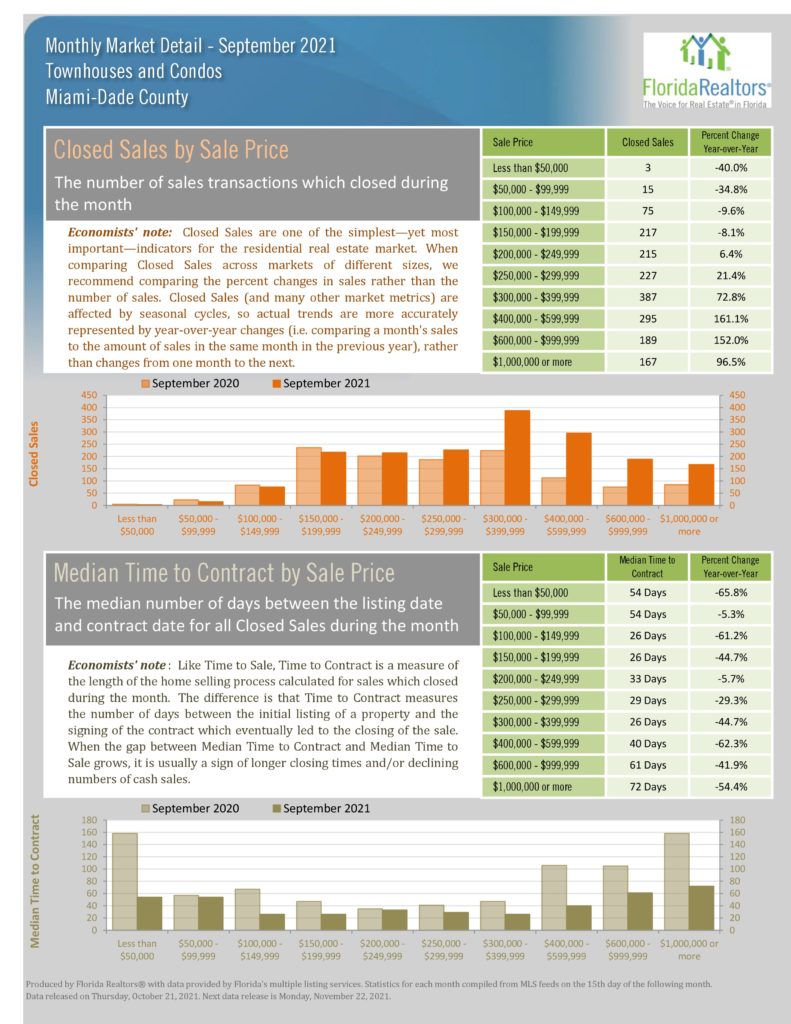
  • Closed Dollar Volume
    • Condos…..$982.9M Up 81.5%
    • SFH……….$1.2billion Up 21.8%

Statistics about traditional, foreclosure/REO, and short sales. One is done over closed sales percentages. The other is done over median sale price.

Statistics chart for new listing by initial listing price and inventory by current listing price.

Statistics chart for closed sales by sale price and median time to contract by sale price.

Statistics chart for inventory (active listings) and month’s supply of inventory. Both have year-to-date (monthly average) and monthly statistics.

Statistics chart for new pending sales and new listings. Both have year-to-date and monthly statistics.

Statistics chart for median time to contract and median time to sale. Both have year-to-date and monthly statistics.

Statistics chart for dollar volume price and median percent of original list price. Both have year-to-date and monthly statistics.

Statistics chart for median sale price and average sale price. Both have year-to-date and monthly statistics.

Statistics chart for cash sales and cash sales as a percentage of closed sales. Both have year-to-date and monthly statistics.

Summary statistics for all September statistics. Close sales statistics chart, with monthly changes and year-to-date numbers.

Share:

Copyright ©. No guarantee, warranty or representation of any kind is made regarding the completeness or accuracy of descriptions or measurements including but not limited to square footage, room count, number of bedrooms, or designated school, and should be independently verified and expressly disclaim any liability in connection therewith. While, information from this website including market statistic data is believed to be correct, it is represented subject to errors, omissions, changes or withdrawal without notice. All material presented herein is intended for information purposes only. No financial or legal advice provided. Equal Housing Opportunity.